
A gridding technique for geospatial matching in Ethiopia
Using novel methods to overcome gaps in administrative data
Context
In Ethiopia, women make up more than half of the agricultural workforce. However due to persistent structural barriers, they have substantially lower agricultural productivity than men. In this context the Women’s Empowerment through Gender Transformative Market Opportunities (WEGO) program aims to address these barriers in Ethiopia’s agriculture sector. WEGO strives to both strengthen gender integration within the Ethiopian Ministry of Agriculture. They also aim to increase income for women farmers through farmer-facing, gender-transformative interventions.
Farmer-facing activities include CARE Ethiopia’s Farmer Field and Business School (FFBS), which aim to empower women and increase household income in agricultural communities in Ethiopia’s Amhara and Sidama regions.
Challenge
Laterite is leading a mixed-methods impact evaluation of this program. The evaluation uses a pre-post design with a concurrent control group to understand whether FFBS improves women’s empowerment and increases household incomes.
Prior to our evaluation, CARE purposively selected intervention locations. These locations had the necessary agricultural and geographic characteristics for cultivating and marketing targeted horticultural products. This step ensured that participating villages, or gotes could meaningfully participate in the horticultural value chains targeted by the intervention. From the perspective of the evaluation however, it presented challenges for identifying comparable control gotes.
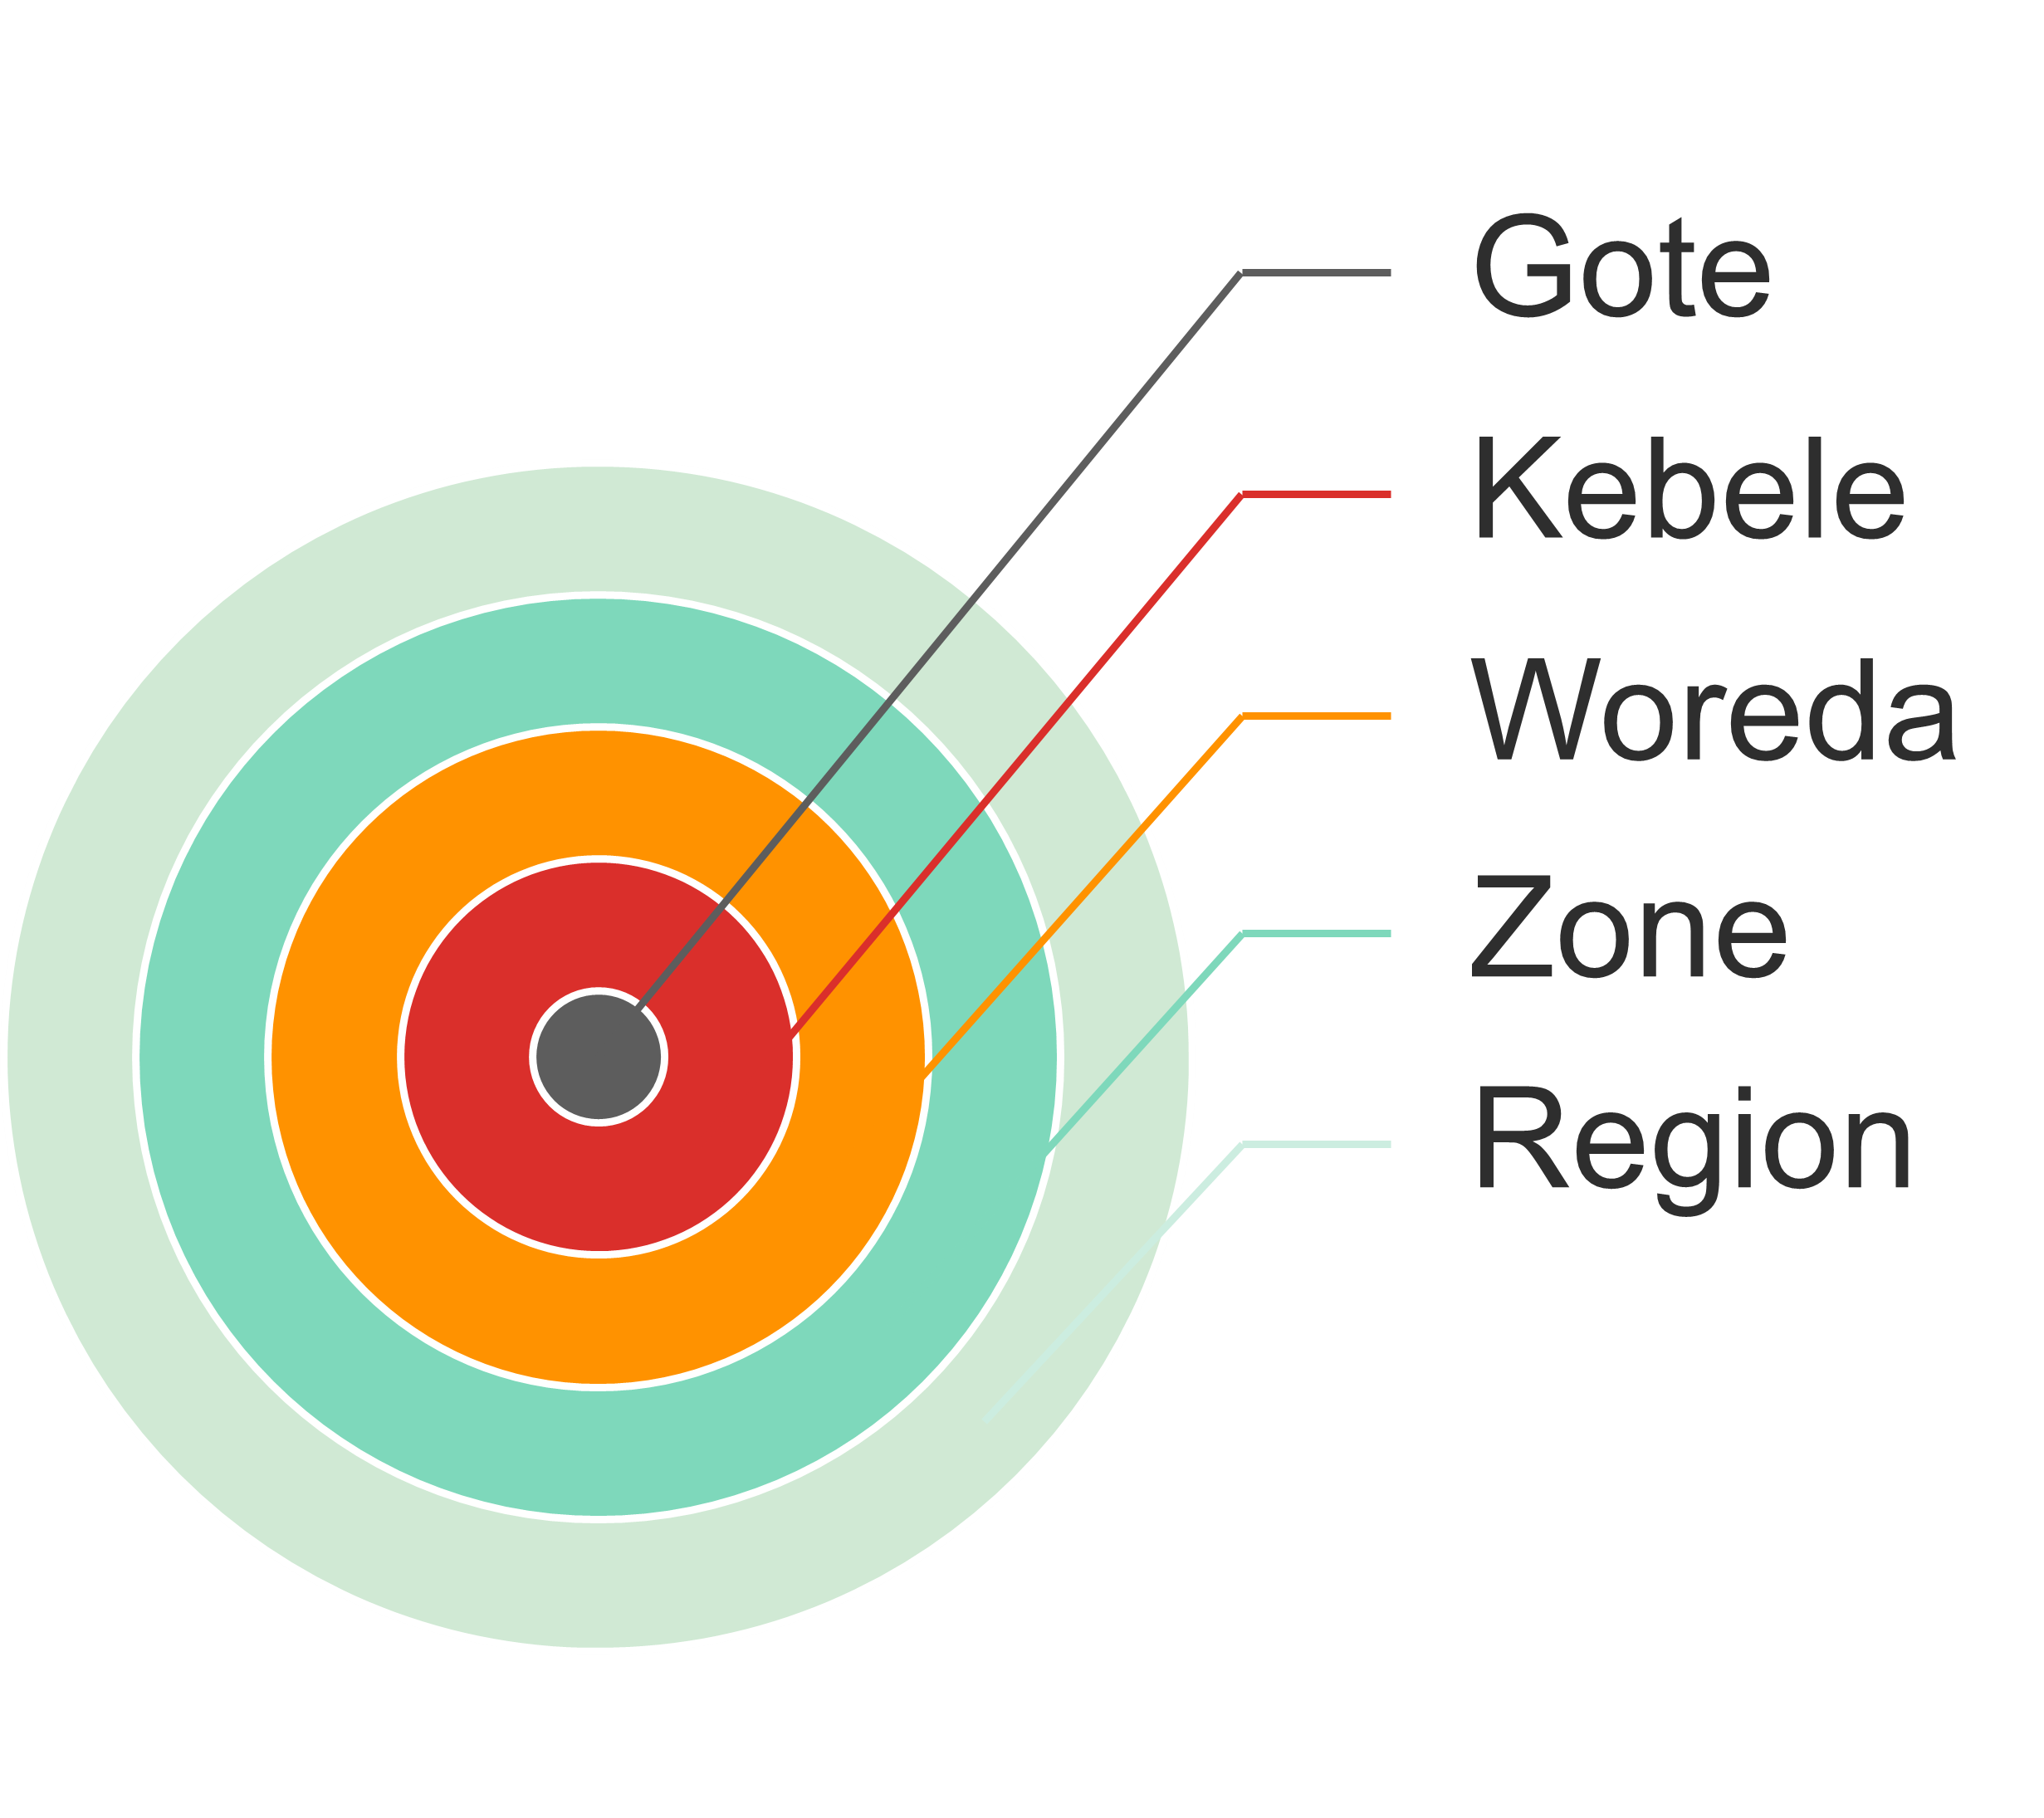
We opted to use geospatial data to identify potential control gotes with similar agricultural and geographic characteristics to CARE’s selected intervention gotes. However, we quickly ran into a second challenge: Ethiopia’s administrative geospatial data did not include the locations or boundaries of individual gotes.
Innovation
To tackle this we took the following steps:
Step 1. We physically visited gotes where the FFBS program was being implemented and obtained a GIS coordinate for the center of each intervention gote.
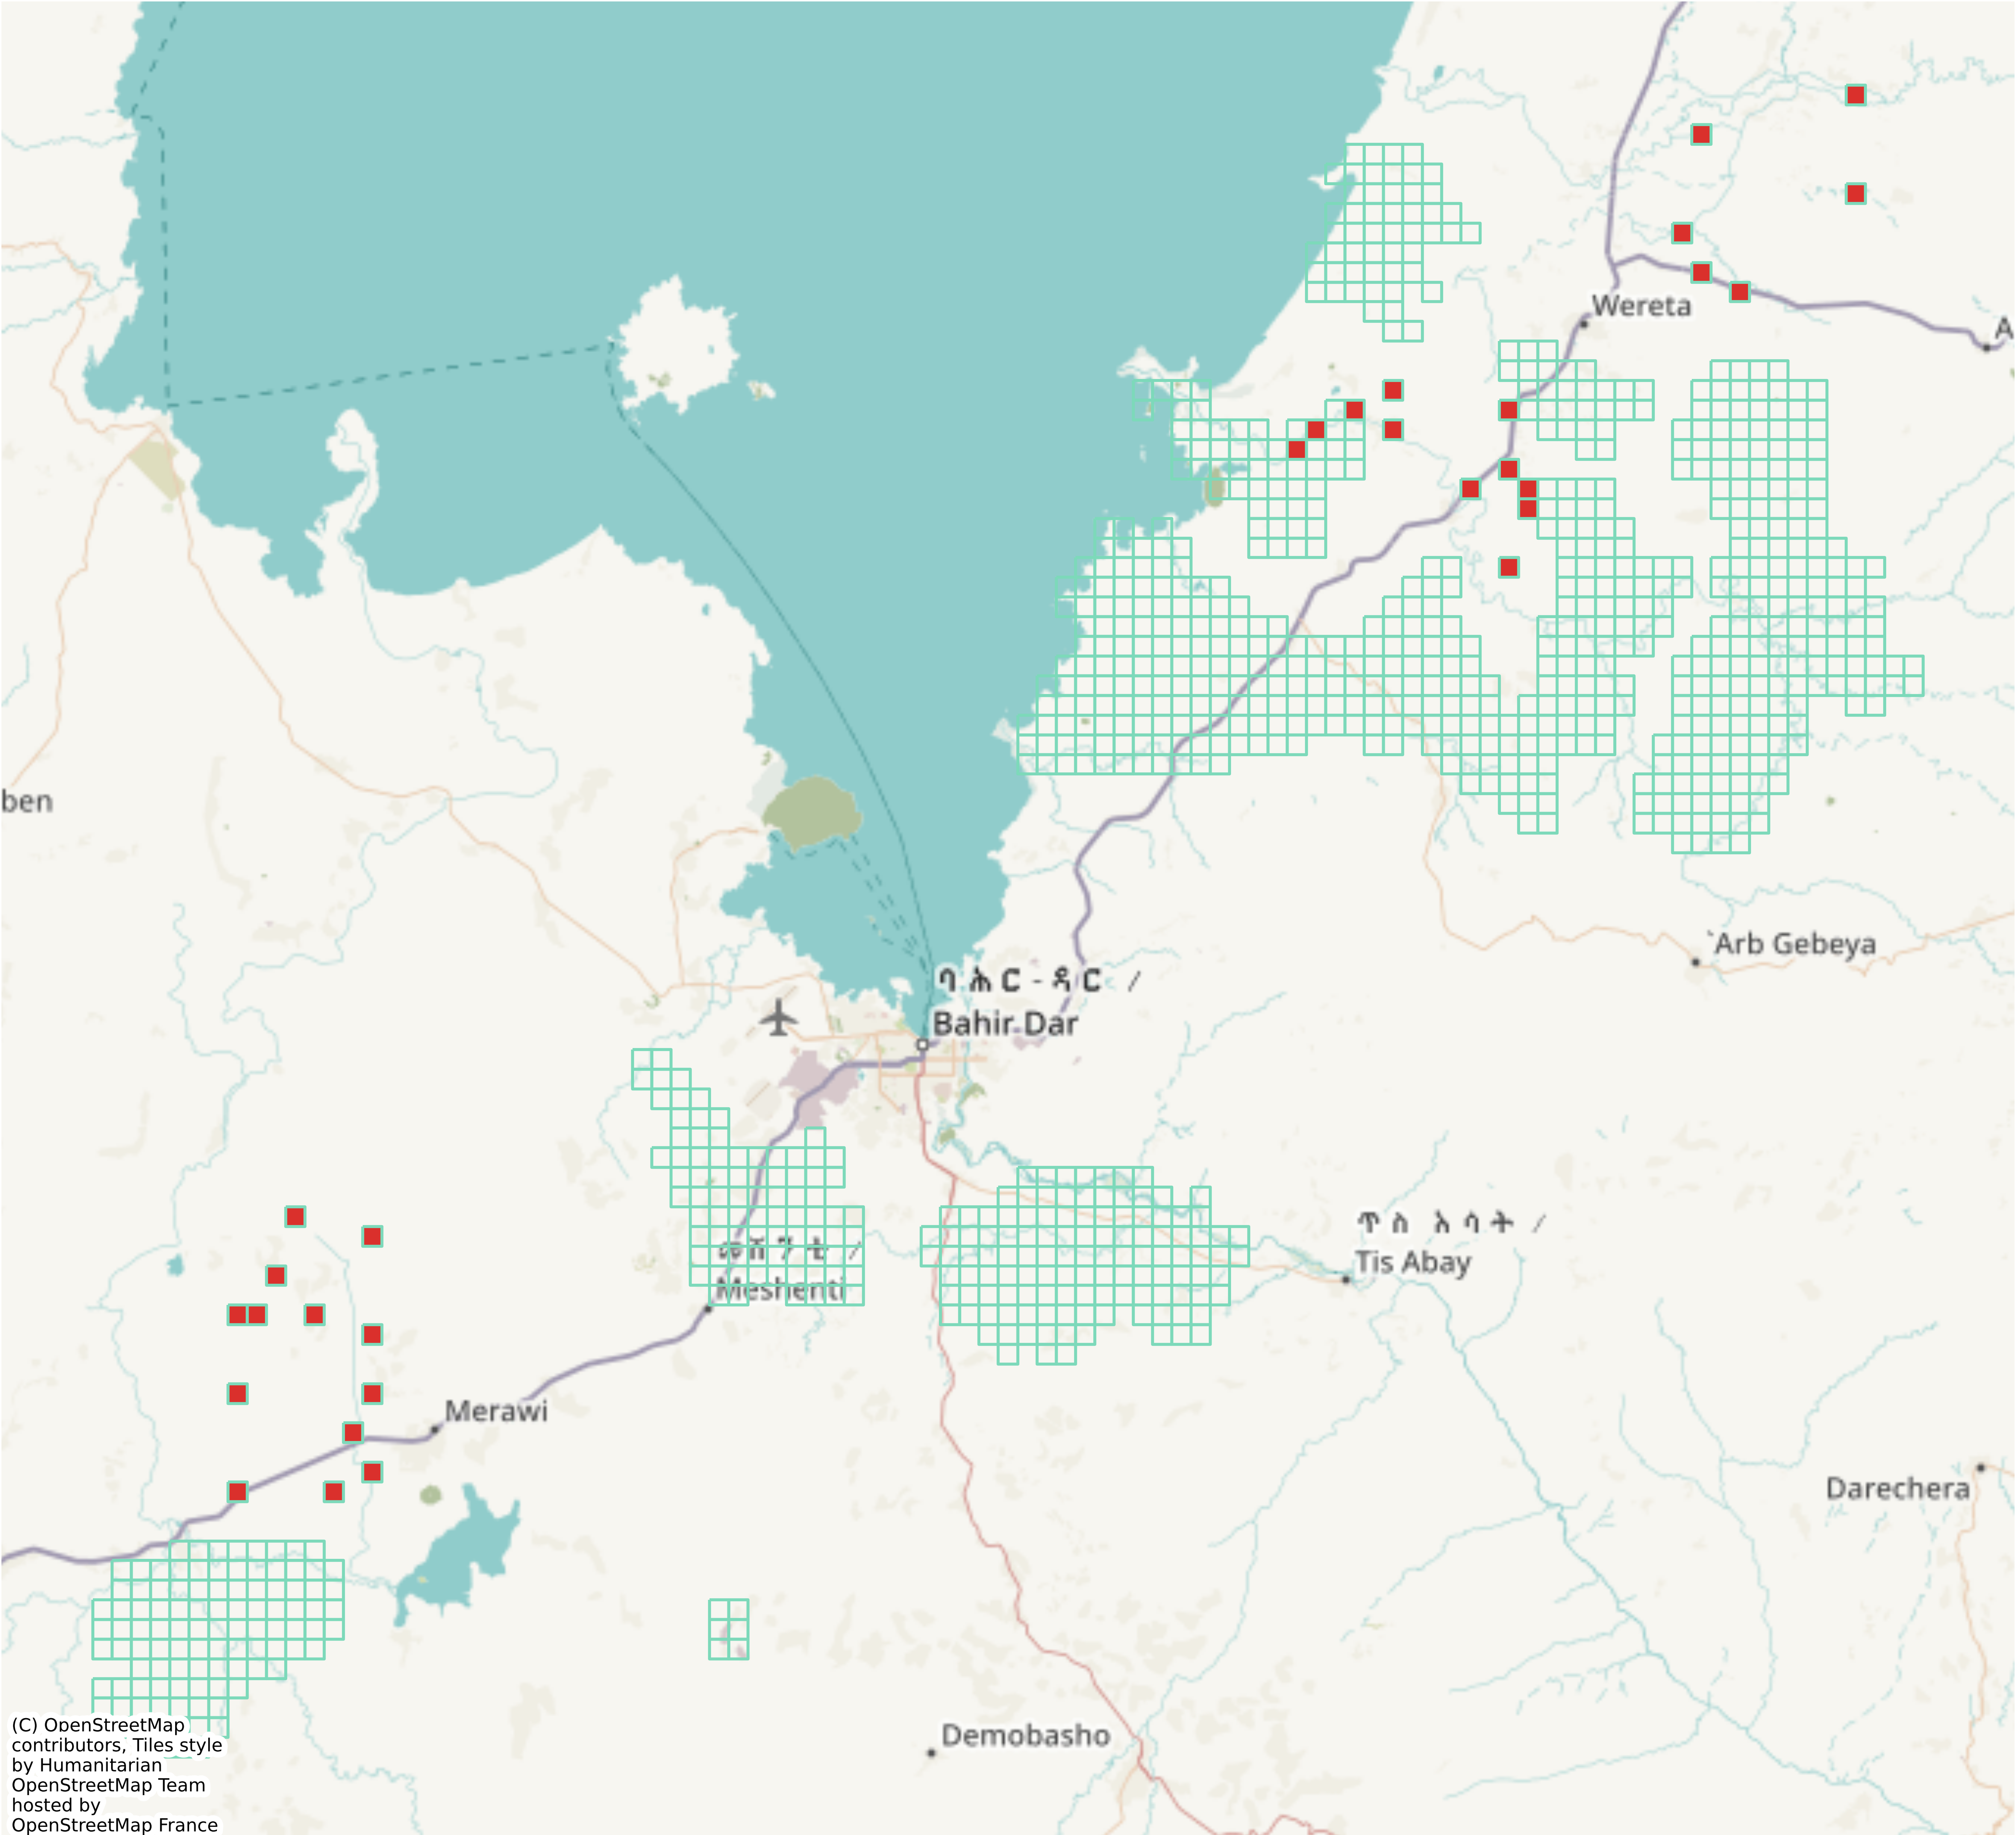
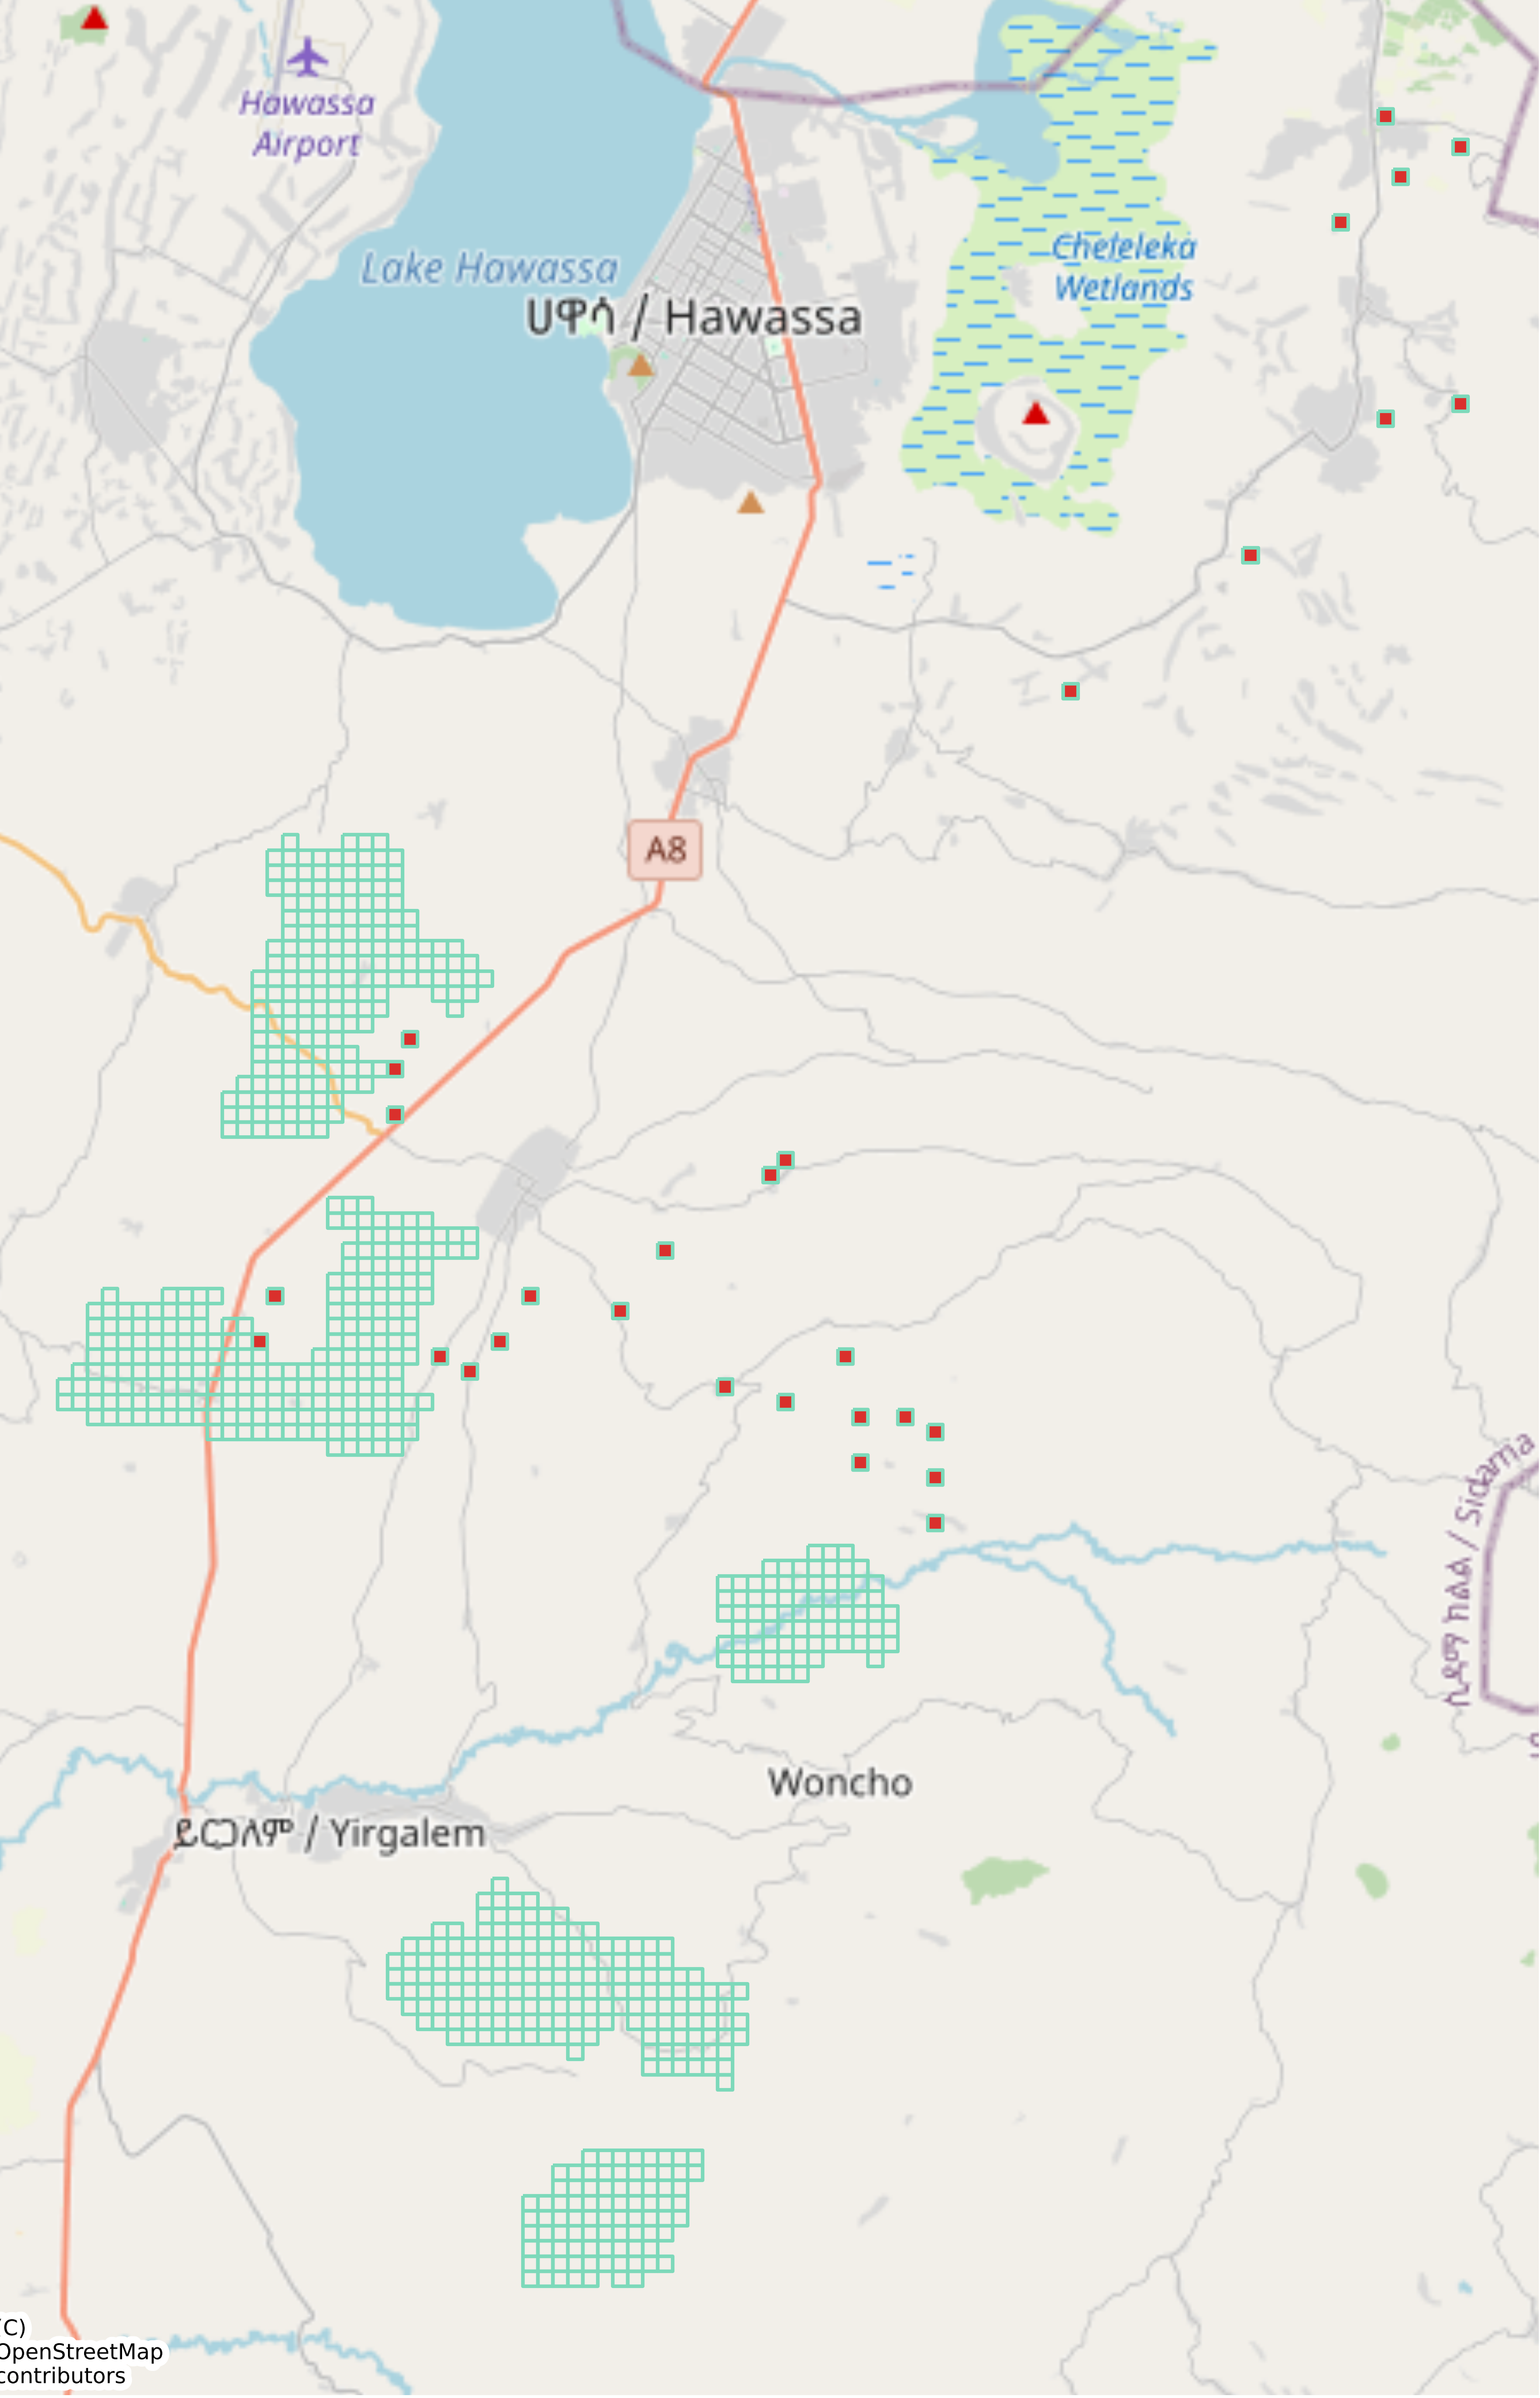
Step 2. Then, we plotted the FFBS gotes on a map and drew a square ‘cell’ centered on that GIS coordinate (red squares in figure below).
Step 3. After that, we identified 26 potential control regions or “kebeles” and overlaid a grid over these kebeles to create a set of potential control ‘cells’ (green grids in figure below).
Step 4. We then extracted geospatial data for each of the FFBS intervention cells created in Step 2 as well as each of the potential control cells created in Step 3. This data came from Laterite’s geospatial database* and Google Earth Engine.
Step 5. Next, we used ‘nearest neighbor propensity score matching’ to select the most comparable control cells for each treatment cell. (See Matching treatment and control groups with geospatial data for more information on different matching techniques).
Step 6. Lastly, we visited the selected cells and conducted a household listing exercise in their surrounding gotes. Data from the household listing was used to select the most comparable control and treatment households for participation in the baseline survey.
Outcome
Our gridding process resulted in a pool of 59 treatment and 1,718 potential control cells. From this, we selected a final set of 40 FFBS (treatment) and 40 matched control gotes. In our final sample, we were successfully able to balance key agricultural, economic, and household composition variables.
One key lesson learned for future gridded matching is that selecting a matching set of gridded locations rather than matched pairs would provide greater flexibility when locations need to be replaced.
*Our interactive geospatial database contains variables on five East African countries: Ethiopia, Kenya, Rwanda, Uganda and Tanzania. These span various geospatial themes from data on an area’s topography, to demographic and environmental data, to information on distances to surfaces. In Ethiopia, our database includes building counts and population counts for infants, males and females.
This evaluation was commissioned under EVITA (Evaluating Inclusive Transformation in Agriculture, INV-004442), which generates evidence on the outcomes and impacts of investments made by the Agricultural Development Team (AgDev) at the Bill & Melinda Gates Foundation.