Sometimes it’s not possible to fully randomize an intervention for an impact evaluation, for example when the treatment group is pre-selected due to program-related reasons. With a randomized control trial out of the way, one of the options is to use a quasi-experimental approach combined with matching methods to select a comparison group.
The quality of such designs hinge on the similarity between a treatment group and this matched comparison group. The trouble with the standard approach to matching is that the similarity between the treatment and comparison group can often only be assessed after a baseline survey. This is not very efficient and often leads to data being collected and then not used in the analysis.
But what if we had an idea of how similar treatment and comparison groups are before collecting any data? We could then target our data collection better by surveying only among respondents and areas that we know are similar to the treatment group.
Selecting a comparison group using geospatial data
Laterite has recently encountered this challenge during our work on the impact evaluation of the Spark Microgrants‘ Advancing Citizen Engagement project in Rwanda. For this assignment, we were given a list of 164 villages earmarked to participate a village-level microgrant plus facilitation program. Our task was to select a suitable comparison group to use as counterfactual in our impact evaluation.
However, fielding a survey team to collect data from 1,000+ potentially comparable villages to find which ones would be most similar to the treatment group was neither practical nor economical. So we decided to follow a different approach: to use geospatial data and matching techniques to determine which villages would be selected as comparison group.
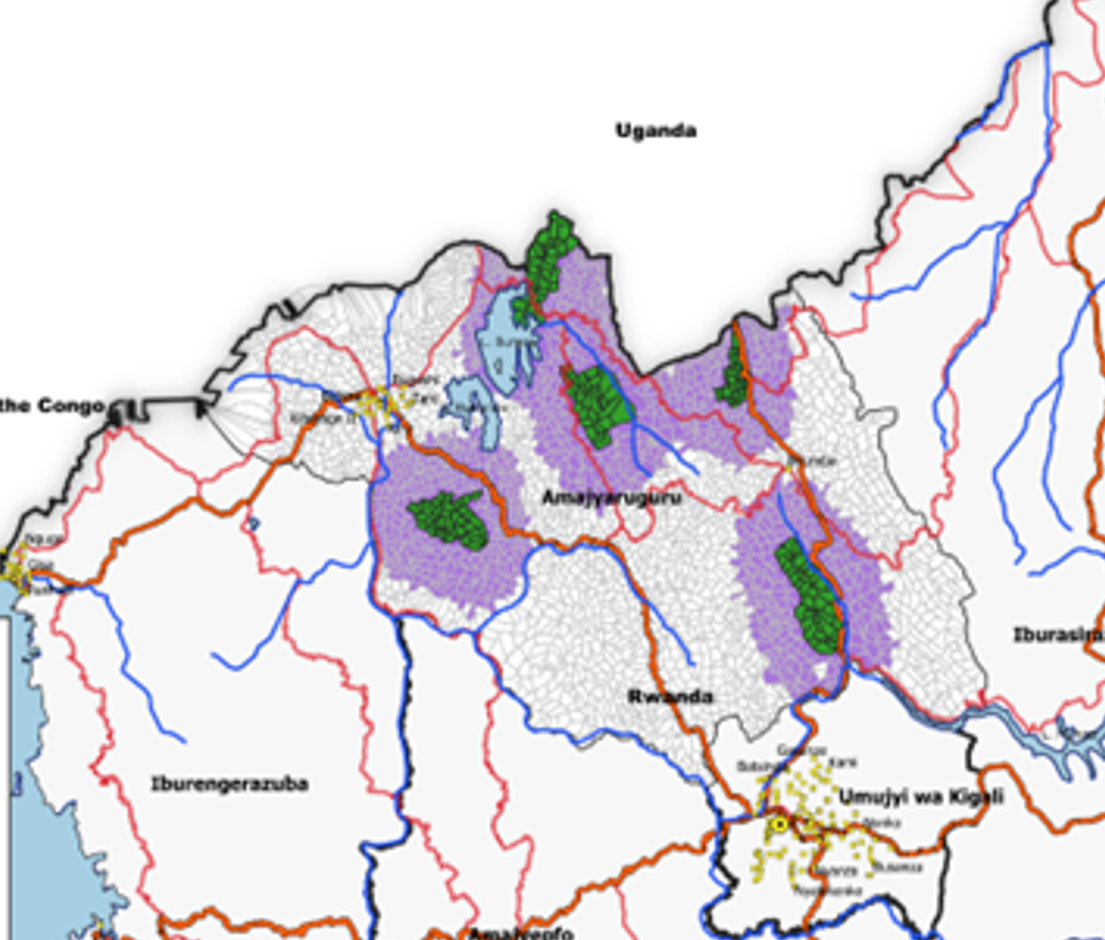
An overview of the study area, with the treatment villages (in green) buffer zones (in purple) and the villages available to be part of the comparison group (in white).
The first step was to collate program-relevant data, and census data, for instance the share of people in each ubudehe category (a poverty classification widely used in Rwanda). Then we added geospatial data on health indicators, night-light intensity derived from remote sensing, wealth proxies derived from a combination of survey data and satellite imagery, land cover and topographic features such as slope and elevation, and the distance to the nearest primary and secondary schools. The combination of all these data sources paints a socio-economic and socio-demographic picture of each village.
Then, for each of the 164 treatment villages we estimated which of the 1,476 potential comparison villages would be most similar to it in terms of geospatial and socio-demographic characteristics. We then paired each treatment village with its most similar comparison using three matching methods.
Comparing three matching techniques
The three matching techniques we tested were:
- Propensity score matching. The probability of a village belonging to the treatment group is estimated with a simple logisitic regression. For this challenge, we implemented a one-to-one match: pairing each treatment village with its nearest neighbor in terms of its estimated propensity score.
- Mahalanobis matching. The Mahalanobis distance tells us how far apart two villages are from each other in a multidimensional space of geospatial features. If two villages have the exact same features, the distance between them would be zero. Mahalanobis distance matching thus aims to minimize this “distance” between treatment and comparison group village. Each treatment village was paired with the comparison village with the lowest Mahalanobis distance.
- Proximity matching with random forests. A random forest is a collection of decision trees, widely used in machine learning, that learns to classify whether a village is either treatment or not, based on geospatial and socio-demographic features. One of the by-products of this classification algorithm is a proximity matrix that records the degree of similarity between all possible pairs of treatment and comparison villages. This proximity matrix can thus be conceptualized as a proxy-measure for multivariate closeness between pairs of villages. We thus selected the closest comparison group village (i.e. highest proximity) for each treatment village.
Which of the matching techniques performed better?
Each matching technique has a different way to calculate best matches. So to compare between them, we assessed which matching method returned the lowest standardized mean difference on each indicator (e.g. socio-demographics, geospatial features) between treatment and matched comparison group.
It turned out that while all matching techniques reduced the differences between the treatment and comparison group, a simple propensity score estimate with a one-to-one match performed the best.
So in the end, we used a propensity score match to create 164 pairs of treatment and comparison group villages. For each village in the treatment group, we now know which village in the Northern province in Rwanda is the most comparable to it. Based on this list, we drew a sample of 48 villages to conduct a highly-targeted baseline survey.
This is one of the many use cases for geospatial data. By taking advantage of this often-unexplored wealth of data, we can now target our comparison group surveys to those areas we know are similar to target areas where our client is implementing the program.
This means less wasteful and more efficient data collection, better targeted surveys, likely higher statistical power, and a more solidly defined counterfactual in our analyses.
This blog post was written by Rik Linssen, Laterite’s Lead Economist.