Evaluating impact with geographic regression discontinuity
The Lake Nasho Case: A Large-Scale Irrigation Program in Eastern Rwanda
Impact evaluation challenges: non-random selection, no baseline, and bundled interventions
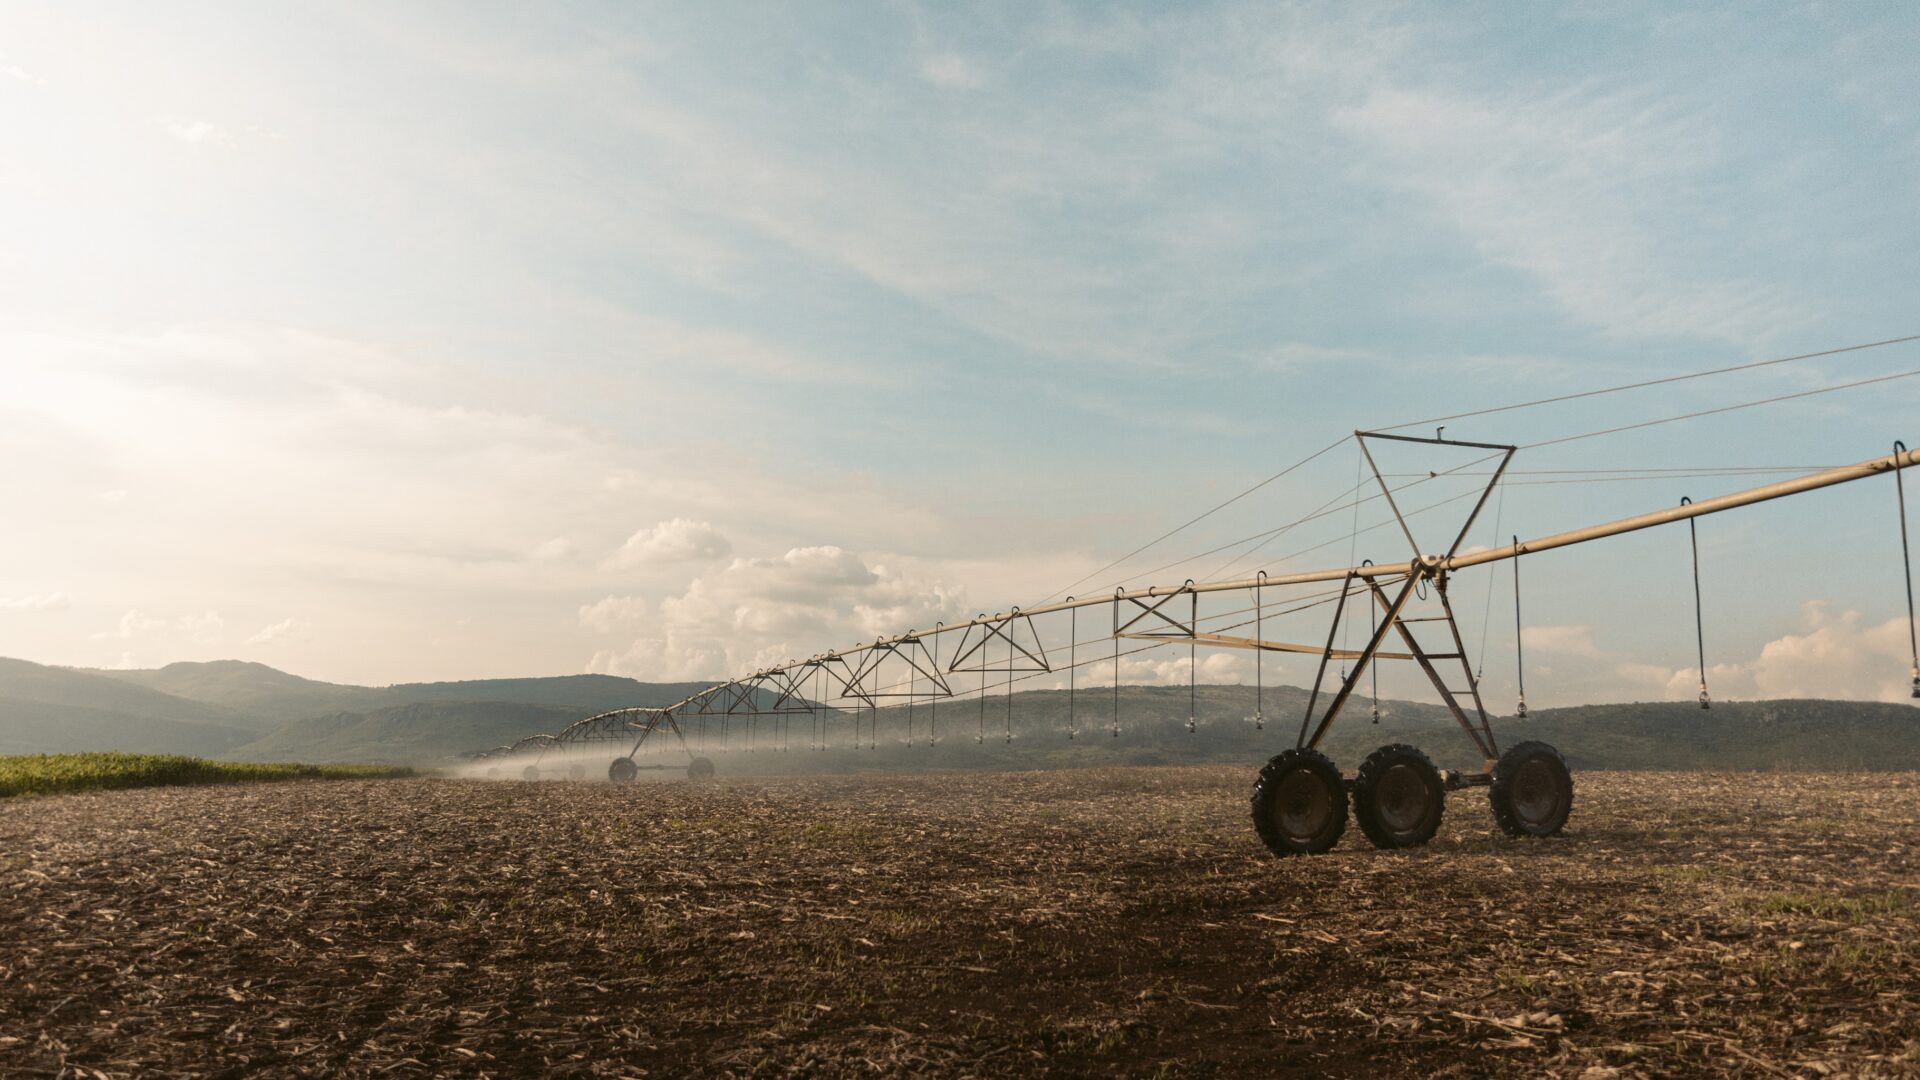
Eastern Rwanda’s Lake Nasho region is prone to drought and unpredictable rainfall, making smallholder farming particularly vulnerable to climate shocks. In response, the Government of Rwanda and the Howard G. Buffett Foundation implemented a large-scale irrigation infrastructure project starting in 2016. The intervention involved installing 63 center-pivot irrigation systems across 1,173 hectares of farmland, covering plots farmed by approximately 2,000 households. In addition, farmers received training and demonstrations on conservation agriculture.
Laterite assessed the irrigation project’s impact at the plot level. The study’s main objectives were to compare crop yields and farming practices between plots inside and outside the irrigated area.
Evaluating the project’s impact posed three methodological challenges:
- No baseline data at plot level was available from before the irrigation systems were installed.
- Irrigation site selection was non-random: The locations of pivots systems were selected based on their proximity to Lake Nasho and providing flat terrain.
- Multiple simultaneous interventions: Additional services like road construction, electrical grid upgrades, and a farmer cooperative were rolled out alongside the irrigation infrastructure. This made it difficult to separate out the impact of irrigation alone.
Our solution: Geographic regression discontinuity design
To overcome the lack of baseline data and the non-random treatment assignment, we crafted an innovative geographic regression discontinuity design (or geographic RDD). Since the impact of the irrigation systems is geographically clearly delimited, we can use the spatial distance to the irrigation pivots to define a treatment and control group.
The core assumption of this approach is simple: The closer plots are geographically, the more similar they will be in characteristics such as soil quality, slope, and received rainfall. This means that we can use the demarcation line around the irrigated areas to define the treatment status: plots within the irrigation zone are the treatment group, while plots just outside form a valid comparison group. Given their close proximity, the plots in both groups should have largely the same characteristics with the only variation being the irrigation status.
We estimated the impact of irrigation at plot-level for two reasons. First, households may farm several plots, both irrigated and non-irrigated, leading to ambiguous treatment assignment at household-level. Using a geographically defined unit of analysis with a geographically defined cut-off variable results in a much clearer definition of the treatment group. Second, plot-level analysis allowed us to isolate the impact of irrigation from the impact of improved infrastructure and the farmer’s cooperative, since the plots inside and outside the irrigation zones were equally exposed to these changes at community level.
Here’s how we built our sampling and analysis framework:
- Treatment group: We used a stratified two-stage cluster sampling approach to select treatment plots. First, we divided the irrigation area into three bands, each with a width of 300 meters, and used these as strata to sample 40 pivots using probability proportional to size (number of plots) sampling. This ensured that sampled pivots were relatively uniformly spread across the total irrigated area, and pivots covering more plots had a higher probability of being sampled. We then sampled 608 plots located inside the selected irrigation pivots using GIS data.
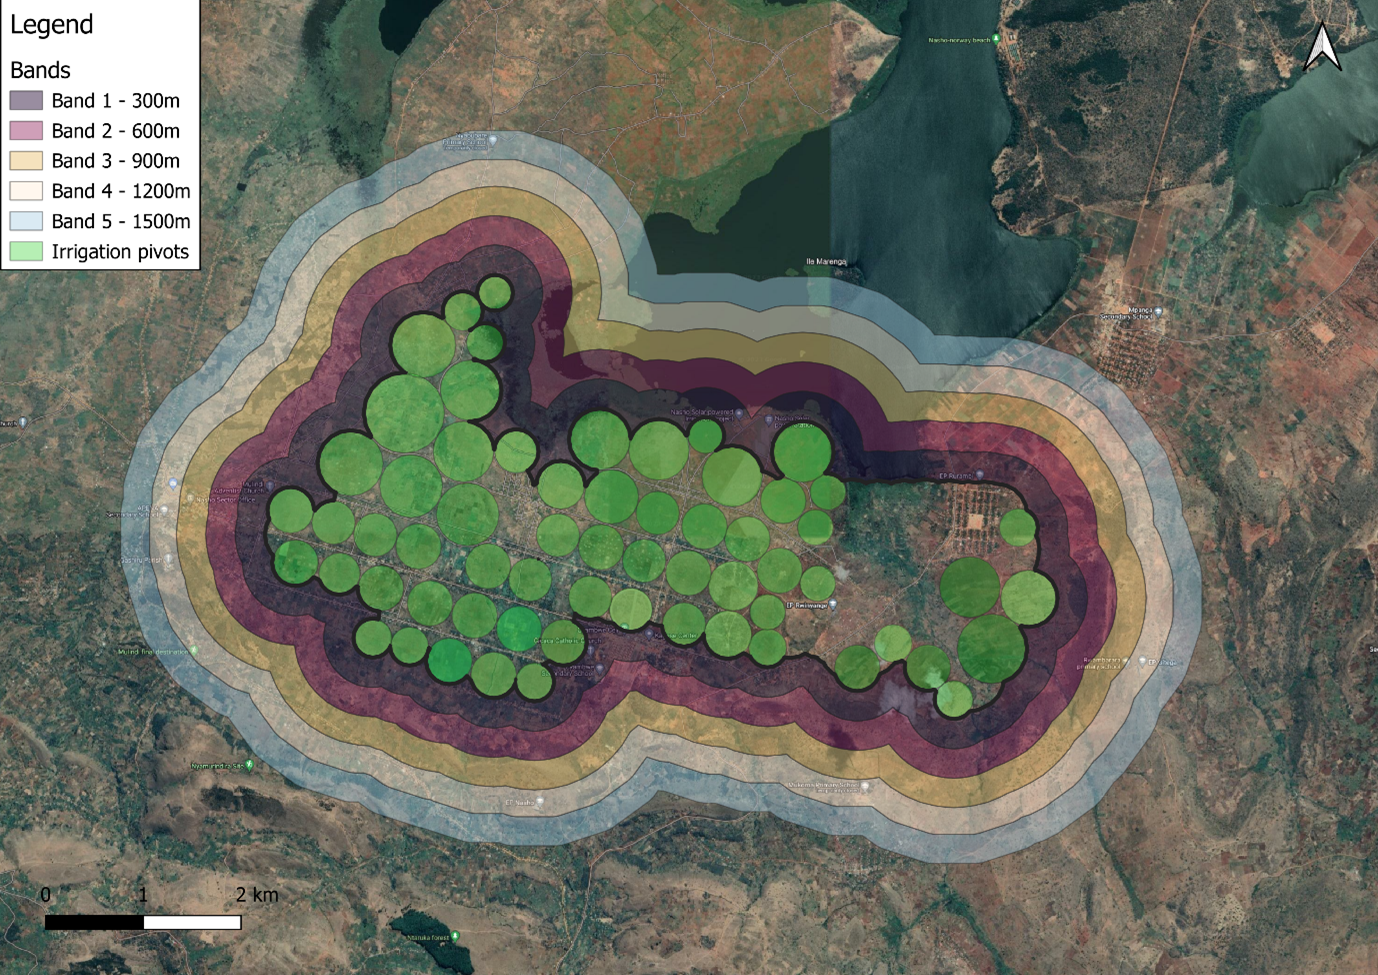
- Control group: To sample the comparison, plots we used stratified GIS sampling. We first established five control bands, each 300 meters wide, extending from 0 to 1,500 meters outside the edge of the treatment area (Figure 1). We restricted the eligible area to cropland. Within each of the five bands, we generated an equal number of randomly placed GIS points. Enumerators used GPS trackers to find the plots corresponding to the GIS points and out of these listed 956 control plots. From the listed plots, we sampled 607 plots.
- Data collection: We conducted plot observations in all of the 1,215 sampled plots. In addition, we interviewed 1,005 households who had farmed one or multiple of the sampled plots during agricultural season A 2024.
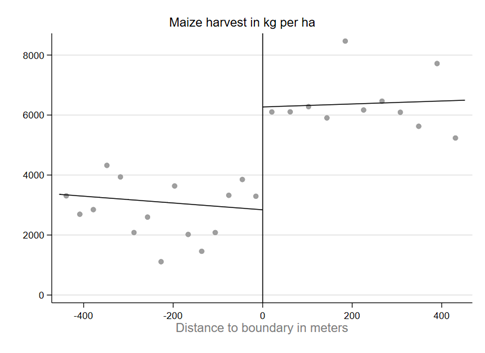
- Analysis: To estimate the impact of irrigation, we used a sharp regression discontinuity model (Figure 2). The distance from the outer-border of the irrigation area served as the running variable, whereby the border was defined as zero and the distance is negative outside and positive within the irrigation area. The cut-off point was set to 0, and we estimated separate linear regressions on each side of the discontinuity. Within the regression models, we controlled for soil type, slope, and level of erosion of the plots to ensure the comparison is as robust as possible.
Key findings
The analysis results showed significant differences in yields, farming practices, and input use between plots in the treatment area and the control area:
- Yields: Inside the irrigation area yields increased on average by 3,204 kg for maize (p-value 0.001) and 1,302.3 kg for soy beans (p-value 0.002).
- Farming practices: 34% of farmers inside pivots adopted conservation agriculture, compared to 15% outside (p < 0.001).
- Input use: Farmers inside pivots invested significantly more in agricultural inputs, including inorganic fertilizer (USD 114 more per hectare), organic fertilizer, pesticides, and hired labor (p < 0.001).
Lessons and implications
This case study shows how a geographic regression discontinuity design, combined with high-precision GIS sampling, addressed three evaluation challenges for the Lake Nasho irrigation project: the absence of baseline data, the non-random selection of sites, and the confounding effects of other bundled interventions happening at the same time. This design allowed us to generate rigorous causal evidence that the irrigation infrastructure significantly increased crop yields, adoption of conservation agriculture, and use of farm inputs. These results provide valuable evidence for the Government of Rwanda and the Howard G. Buffett Foundation to shape future projects and policy decisions.
The geographic regression discontinuity design can be a great tool for researchers in contexts where traditional evaluation methods would otherwise not be feasible. If you think it may be the right approach for your project, here are a few crucial requirements and limitations, you should consider:
- The intervention you evaluate must have a clear geographic scope with a clearly defined boundary.
- The boundary should not be easily manipulated and not drawn in response to pre-existing differences in land quality or socioeconomic conditions.
- You need high-quality spatial data for GIS sampling, measuring distances precisely, and controlling for confounding variables.
- Impacts are only estimated locally at the boundaries. As a result, findings may not generalize to areas farther away from the treatment area.
This case study was written by Judith Bayer, Research Manager at Laterite.