At Laterite, we’ve been using geospatial data to support our work in development research. Geospatial data uses remote sensing data collected by sensors, satellites, phones and drones. Our interactive geospatial database contains variables on five East African countries: Ethiopia, Kenya, Rwanda, Uganda and Tanzania. These span various geospatial themes—from data on an area’s topography, to demographic and environmental data, to information on distances to surfaces.
We’ve used our in-house geospatial database to better understand areas where survey data is limited. We also use it to support a more streamlined listing process for projects with large samples.
Below, we share four interesting maps showing how we use geospatial data for development research projects.
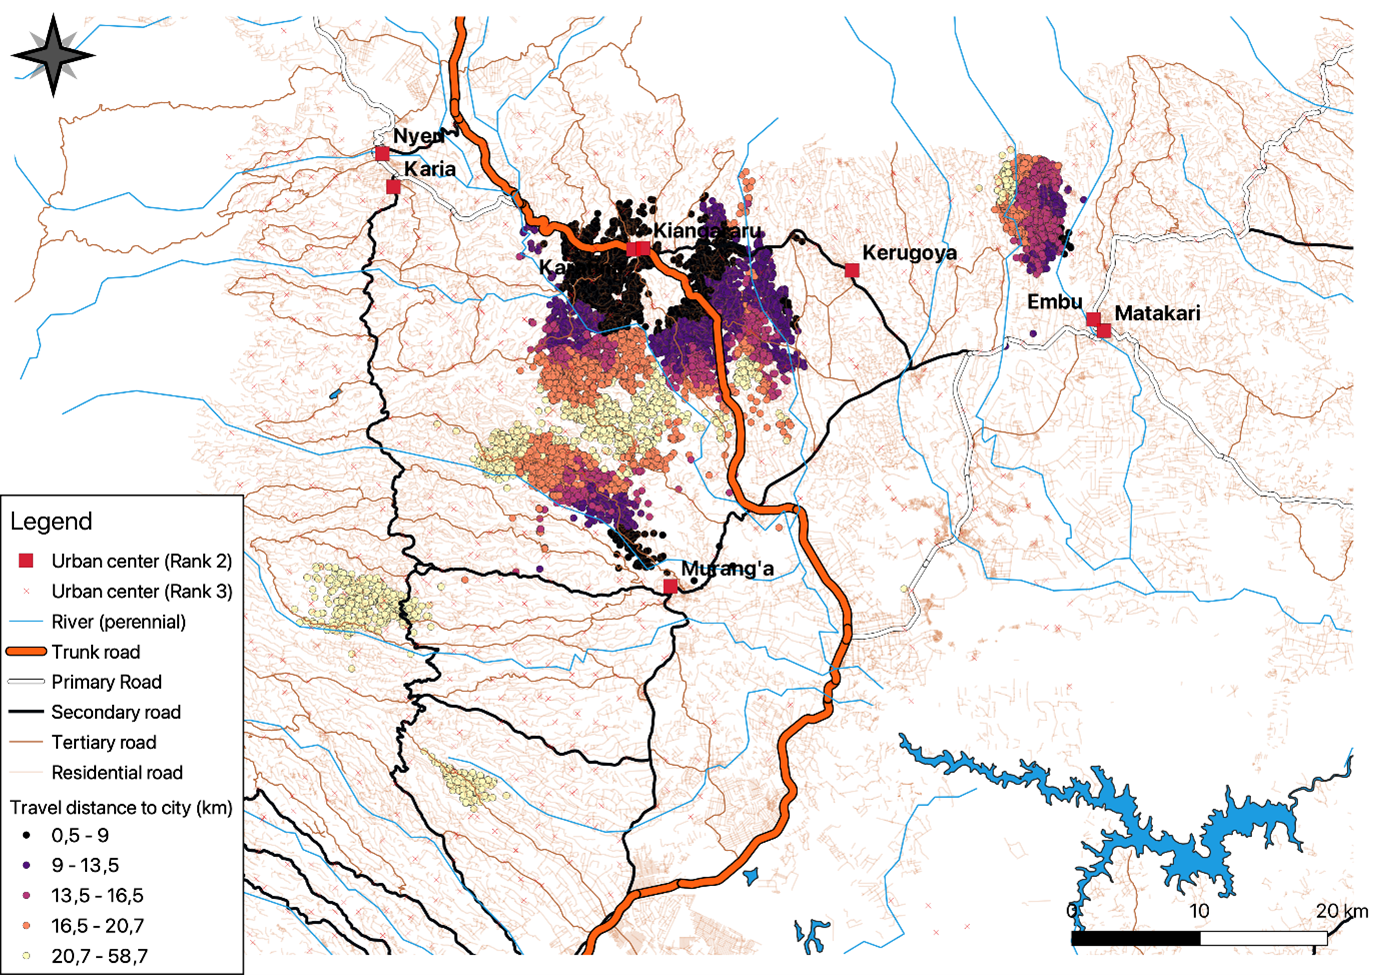
Understanding coffee farming household remoteness in Kenya
We’ve used our geospatial database for a learning partnership on the impact of a coffee agronomy program in Kenya. To study the effects of remoteness in coffee productivity, we mapped road networks to illustrate farmer households’ distance to urban areas. The different colored dots represent a household’s distance to the nearest city, with lighter colored dots being further away. The assumption is that more isolated farmers experience higher costs. They also have less access to markets, negatively impacting their productivity.

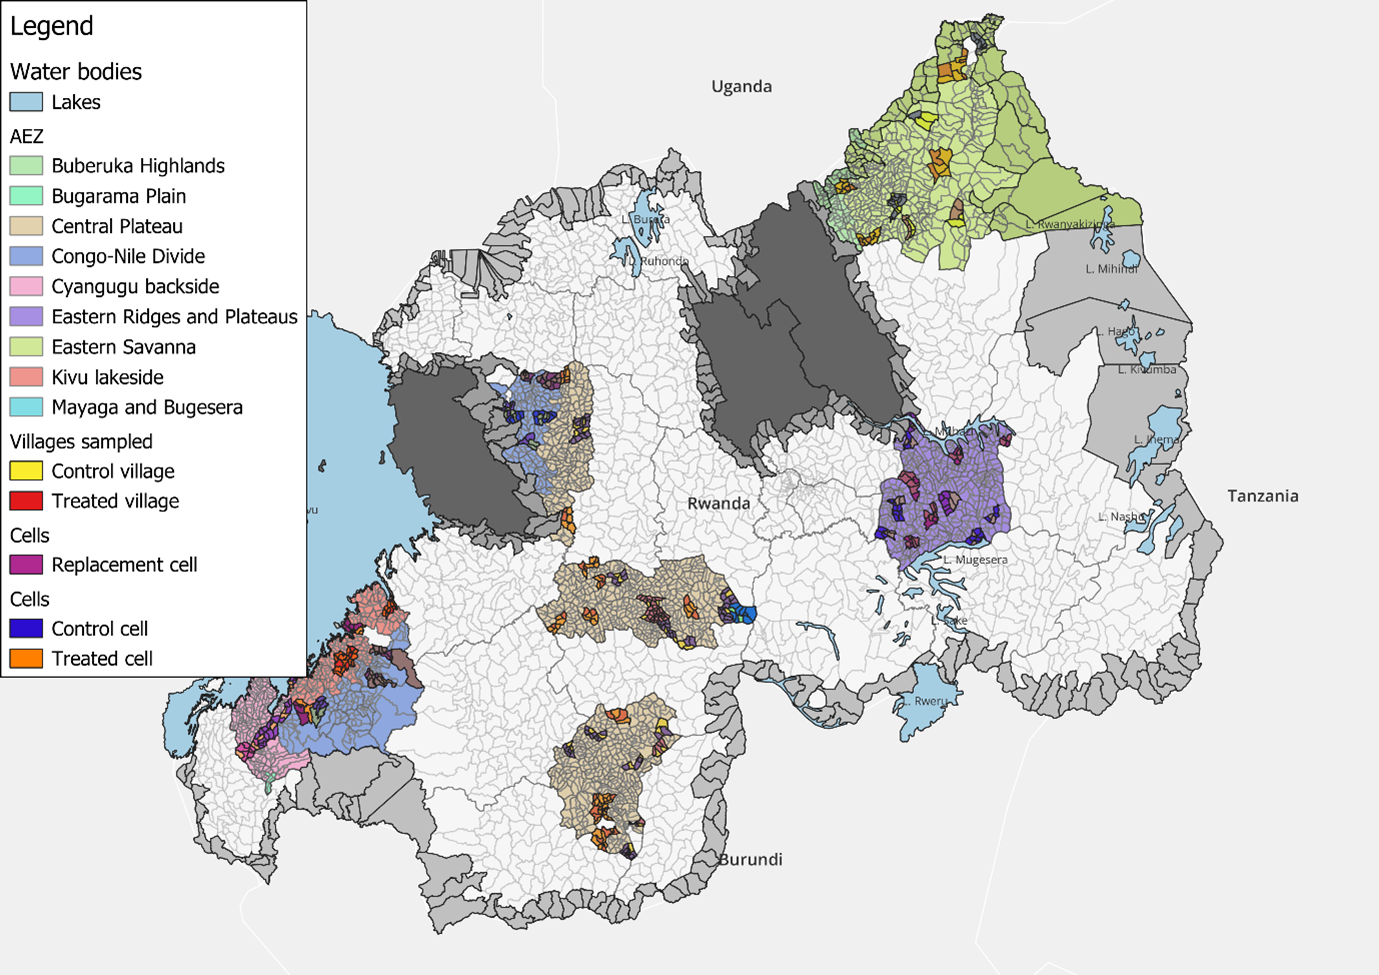
Mapping sampled areas in Rwanda’s Agro-Ecological Zones
Next, this map of Rwanda highlights ecological areas of interest alongside project treatment and control villages for this agroforestry project. The map illustrates their distance in relation to important geographic elements like Agro-Ecological Zones. We can see that the sampled villages are situated within these various Agro-Ecological Zones spread out across the country.

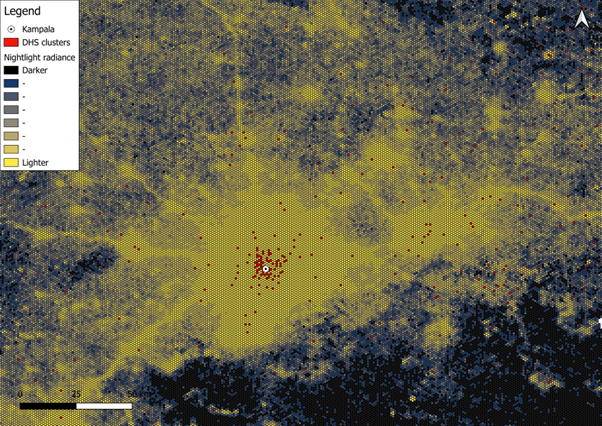
Determining wealth through Ugandan night lights
We sought to understand wealth in Ugandan areas which the Demographic Health Survey (DHS) does not cover. To do this, we created a map standardizing data from the DHS survey (clusters in red) alongside data on nighttime radiance. This map shows electrification levels in the areas surrounding Kamapala, revealing potential indicators of household wealth.

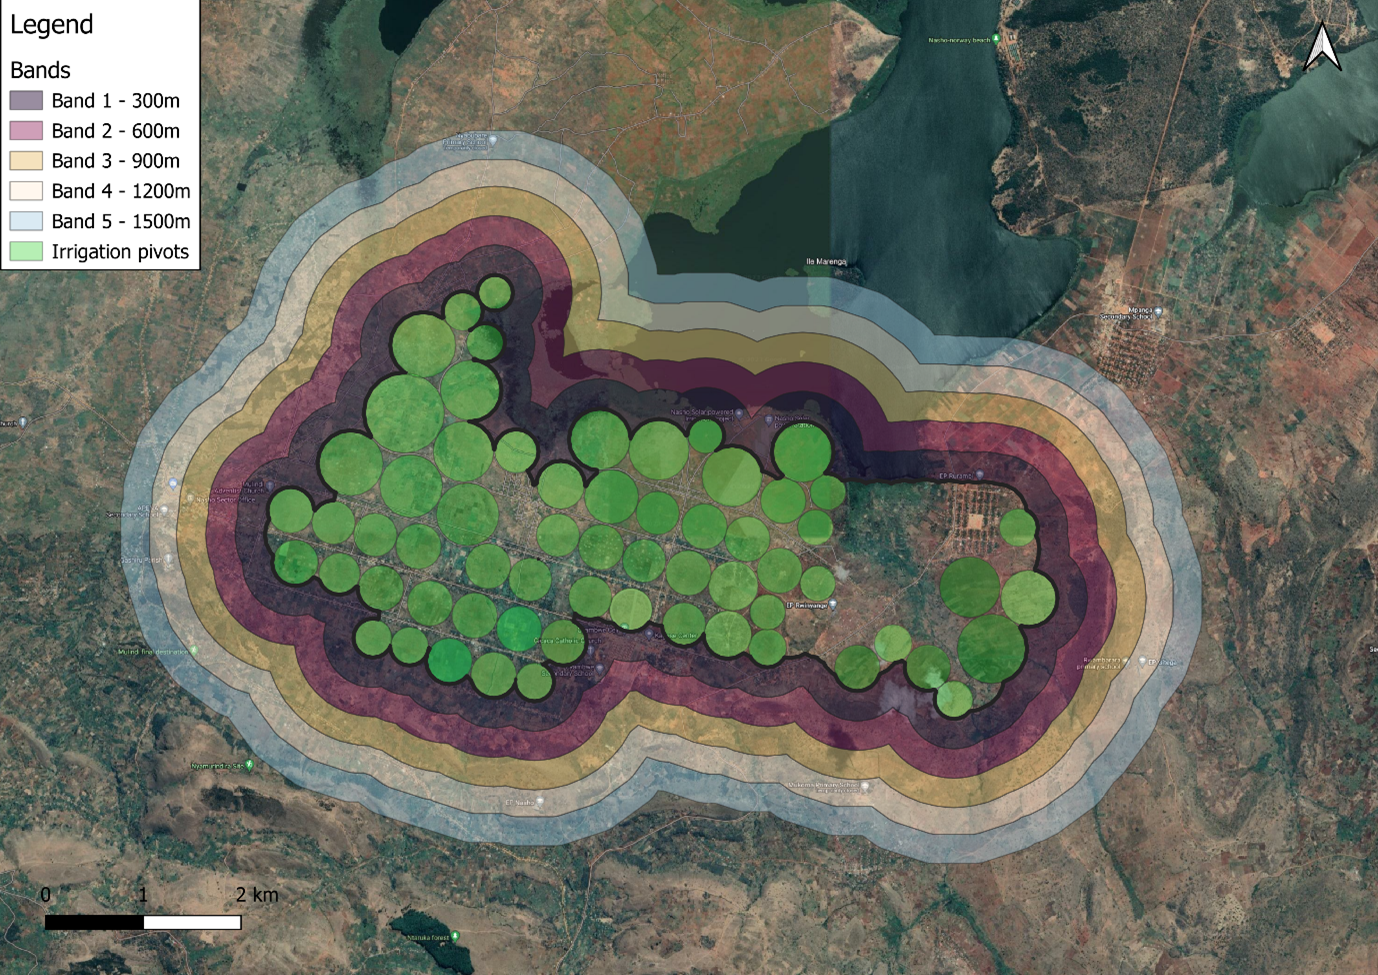
Leveraging geographic discontinuity for an impact evaluation on irrigation in Rwanda
Lastly, Laterite evaluated a large-scale irrigation project in Eastern Rwanda. The impact evaluation leverages a geographic discontinuity to sample plots with and without access to irrigation. Plots inside the pivots’ radius (green circles) receive access to irrigation, while plots outside the circles do not. To generate the comparison group, we created 5 control bands located within 300-meter buffer zones (colored bands) outside the edge of the treatment area.

The applications of geospatial data in our work show that this can be a helpful tool at any stage of the research process. We’ve used it in selecting treatment and control groups but have also incorporated it to our analyses, increasing our understanding of how geography impacts outcomes for populations in East Africa. We also know that we are just at the tip of the iceberg: more can be done with this rich resource in the future.
This post was written by Associate Economist Jose Rubio-Valverde and Jessie Ramirez, Business Development & Communications Associate at Laterite.