
Last month, we shared our new tool that uses synthetic control methods to predict a country’s COVID-19 trajectory based on the experience of other countries. As we continue to test and fine-tune the tool, what have we learned about how it performs?
Two ways of generating predictions using synthetic control methods
Our tool can generate projections based on two different methods: microsynth and proximity controls.
The microsynth method is based on traditional synthetic control methods as developed by Abadie and Gardeazabal (2003). For the purposes of our COVID-19 projections tool, the microsynth method uses data from the COVID-19 trajectory of other countries to create a synthetic “country” that is made up of a combination of different countries that are further ahead in the COVID-19 crisis. By comparing the outcomes in a location of interest with a synthetic counterfactual “country” at multiple points in time, we can predict how the situation may look in the future.
This outcome can also be achieved using the proximity controls method developed by Laterite researchers Dimitri Stoelinga and Sachin Gathani (2013). This method is very similar, except that it works in two steps: first the model selects the group of comparison countries that are most similar to the target country based on specific characteristics; then many different potential synthetic combinations of these countries are created, providing an average prediction with a range of possible outcomes.
We have shown that both methods can be used to make projections, but which one works better?
Proximity controls vs microsynth methods
Early indications suggest that the microsynth method validates particularly well, while the proximity controls model tends to underestimate the actual figures. For example, last month our model predicted 37,500 COVID-19 related deaths in the United States by 22 April using the proximity controls method, while the microsynth method predicted 43,000 deaths. The actual figure was 45,000.
Using the same parameters, the proximity controls method predicted 13,000 COVID-19-related deaths in the United Kingdom by 22 April, while the microsynth method predicted 20,200 – which was the actual number of deaths (figures rounded to the nearest hundred).
Why is this the case?
We suspect that this is because the microsynth method does not restrict the choice of countries from which the counterfactual is generated: the algorithm simply looks for the best match to the target country, using all countries and taking the specific model parameters into account. It then provides the one best option as the prediction.
On the other hand, the proximity control method creates thousands of possible combinations of similar countries, creating many different versions of reality. The line we see in the model shows an average of those versions. This means it can be disproportionately influenced by outliers – in this case, countries with lower death rate increases compared to the relatively steep increases we see in the countries we focus on in this post. This may lead to a bias towards under-projecting.
How does the microsynth model stack up against epidemiological models?
Epidemiological models of death rates in the US predict between 99,000 and 112,000 COVID-19-related deaths by 30 May, with a lot of variation around the mean. Our synthetic prediction falls on the lower end of these models, at an estimated 97,000 deaths by 30 May.
In the coming month, we will continue to monitor the accuracy of our model’s predictions to see how it compares as the crisis progresses.
In the meantime, you can try it for yourself.
Forecasted number of COVID-19-related deaths in the USA by 30 May 2020
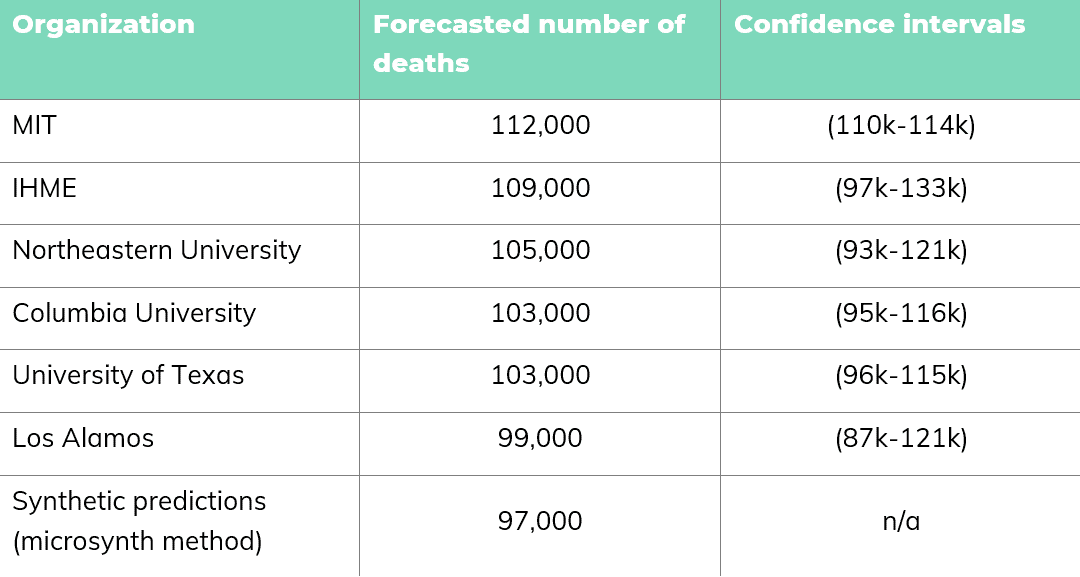
Source: FiveThirtyEight
Microsynth COVID-19 predictions for the USA to 30 May 2020
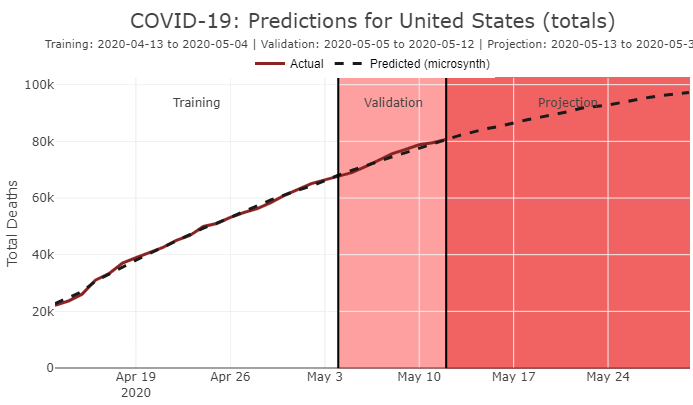
Note: Model uses a start date of 13 April 2020, with 22 training days and 26 shift and projection days.
—
References
Abadie, A. & Gardeazabal, J. (2003). ‘The economic costs of conflict: a case study of the Basque country’. The American Economic Review, 93(1), pp. 113–132.
Gathani, S. & Stoelinga, D. (2013). ‘Export similarity networks and proximity control methods for comparative case studies’. Journal of Globalization and Development, 3(2), pp. 1-39.
This tool was developed by David Wickland, Research Analyst Laterite Ethiopia, and Dimitri Stoelinga, Managing Partner.