
In July 2015, the World Bank presented its 8th Rwanda Economic Update. Yoicho Ishihara, Senior Economist at the Bank, and Gunhild Berg, the Financial Sector Specialist, presented the strategic role of the financial sector in supporting Rwanda’s development. The World Bank researchers summarized the state of Rwanda’s economy in a concise and graphical way: in four graphs.
We have reproduced those graphs here using publicly available data. We believe these graphs capture the most important features of Rwanda’s economy:
- high growth and low income,
- high public and low private investment
- low exports, and
- high aid inflows.
High growth, low-income country
Rwanda has been experiencing stellar rates of growth for the past decade, averaging 7.6% per year from 2004 to 2014. It is one of the fastest growing economies in Africa and in the world. Its stable political and business environments, attractiveness for investors and international donors and dynamic key sectors like export-oriented agriculture and tourism are all contributing to the country’s impressive recent economic record. But Rwanda remains a low-income country, with an income per capita per year of USD 652. The government’s ambition is to turn the country into a middle-income country by 2020. To do this it must increase GDP per capita by USD 393 in 5 years. The graph below summarises these characteristics.
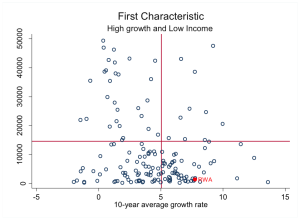
Source: World Bank
High public and low private investment
An important factor of Rwanda’s high growth is the high level of public expenditure. While the government sees the private sector as the engine of Rwanda’s development in the near future, the private sector still lags behind the government in terms of investment capacity. Government expenditures account for 15% of the national income while private investment has been stable at 8%. This is below the average of countries for which data is available: 14%.
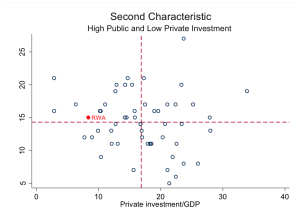
Source: World Bank
Low reliance on exports
Rwanda is less reliant on exports than other African countries. The value of Rwanda’s exports in 2013 totalled 15% of the national income, lower than Kenya, Uganda and Tanzania. Rwanda’s exports are concentrated in two sectors: minerals and petroleum (metals and refined oil), and agriculture (tea and coffee). These accounted for almost three quarters of Rwanda’s exports in 2013. The bar chart below represents Rwanda’s export value in 2013 as a share of national income, along with those of selected African countries.
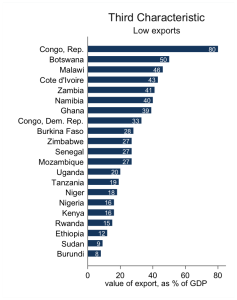
Source: World Bank
High aid inflows
Finally, Rwanda is a big recipient of international aid. In 2013, Official Development Assistance (ODA) represented 14% of GDP, more than Tanzania (8%), Uganda (7%) and Kenya (6%) but less than Burundi (20%). Because international aid is a central component of the Government of Rwanda’s annual budget (typically 30-40%), fluctuations in aid inflows can have serious consequences for the national economy. For instance, following an aid shortfall in 2012, economic growth decelerated from 8.8% to 4.7%. The chart below represents the share of ODA in 2013 GDP for selected African countries.
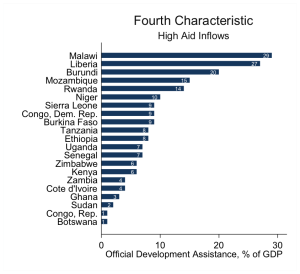
Source: World Bank
In sum, Rwanda is an economy characterised by low income but high and sustained economic growth. Public investment is still much more substantial than private investment, and the level of exports is low and the country receives large amounts of international aid. While Rwanda’s economic development is a complex process, these four graphs offer a quick introduction to Rwanda’s most important economic features.