In development research, our most underutilized asset is the vast body of knowledge we’ve collectively produced. Reports, datasets, and evaluations often sit in isolation, their potential value left unused in digital graveyards. The critical flaw in our current approach is the assumption that new insights require new data. In reality, the most significant breakthroughs are often latent, hidden in the connections – and contradictions – between the data we already possess.
The real challenge is not one of discovery, but making connections across existing information. With the sector facing tighter budgets, we have an opportunity to shift toward AI-powered ways of combining and reusing evidence. The goal is to create knowledge hubs where scattered findings can interact, generating new lines of inquiry and turning a static archive into a dynamic intelligence asset.
We need to become better at using existing data to answer development research questions more efficiently.
A few challenges get in the way:
- Data and insights are fragmented across formats and datasets that cannot communicate with one another
- Information may be out of date, missing, or contradictory
- No individual can keep up with all available evidence, which leads to slower or weaker decision-making
- Exploring and analyzing information is time-consuming and inconsistent
The beauty and power of GraphRAG for development research
Laterite’s Analytics team sees an opportunity to address these challenges with a combination of new and established technologies. “GraphRAG” blends knowledge graphs with Retrieval Augmented Generation (RAG), creating a powerful way to store and access information.
Let’s break down the components:
- A knowledge graph is an older idea, with roots in conceptual frameworks from the 1970s. Google Search uses them extensively. Knowledge graphs organize information as networks of nodes and edges. Nodes represent concepts – countries, languages, population characteristics – and edges explain the relationships between them. For example, the node “Amharic” could be connect to the “Ethiopia”, via the edge “is spoken in”. A knowledge graph can become extremely detailed when representing complex topics.
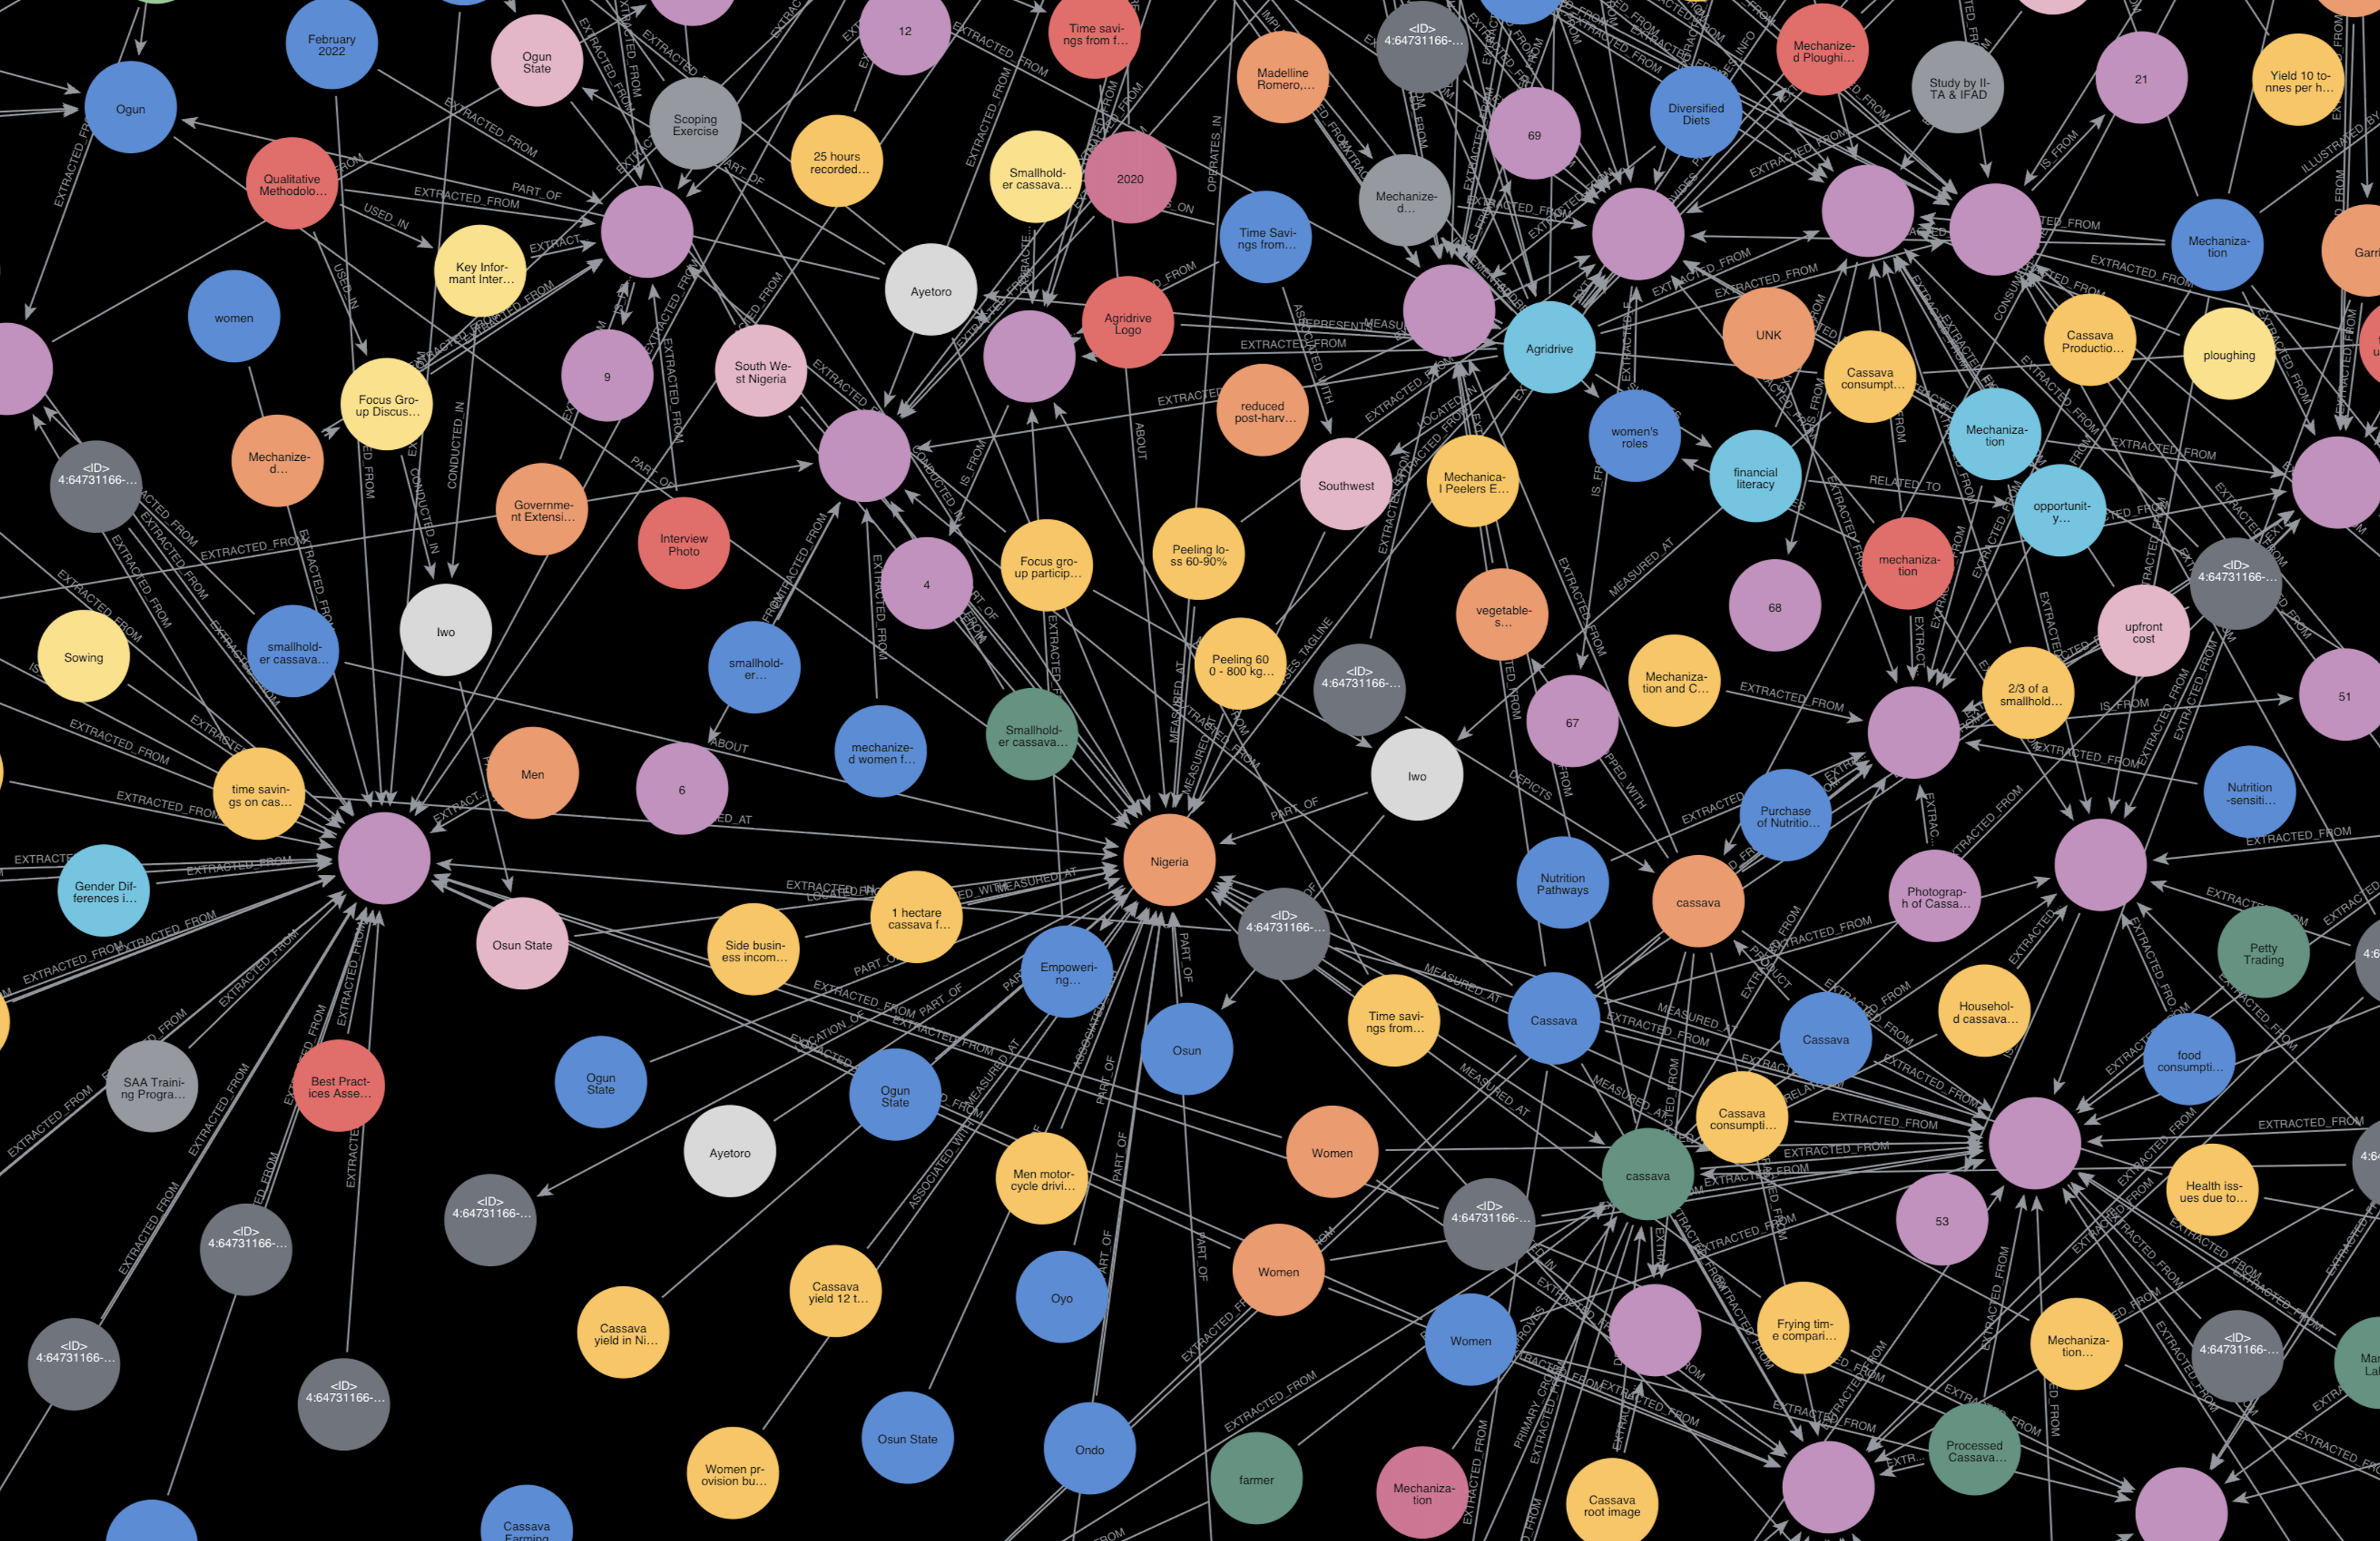
Photo: knowledge graph built on Laterite’s portfolio of gender and nutrition research. Circles are the nodes, and lines are the edges.
- Retrieval Augmented Generation (RAG) is a newer technique. It gives an AI system like a large language model (LLM) access to curated, trustworthy data when responding to prompts. Early systems like GPT-3 often produced inaccurate answers because they relied only on their training data. RAG reduces these hallucinations by grounding responses in real documents.
By combining “Graph” and “RAG” we can build a powerful system capable of reducing hallucinations and uncovering entirely new insights. Classical RAG pulls relevant data from a text database. GraphRAG can also compute relationships and variables across the knowledge graph. This lets users retrieve much richer and more conextualized information with a single query.
Building blocks
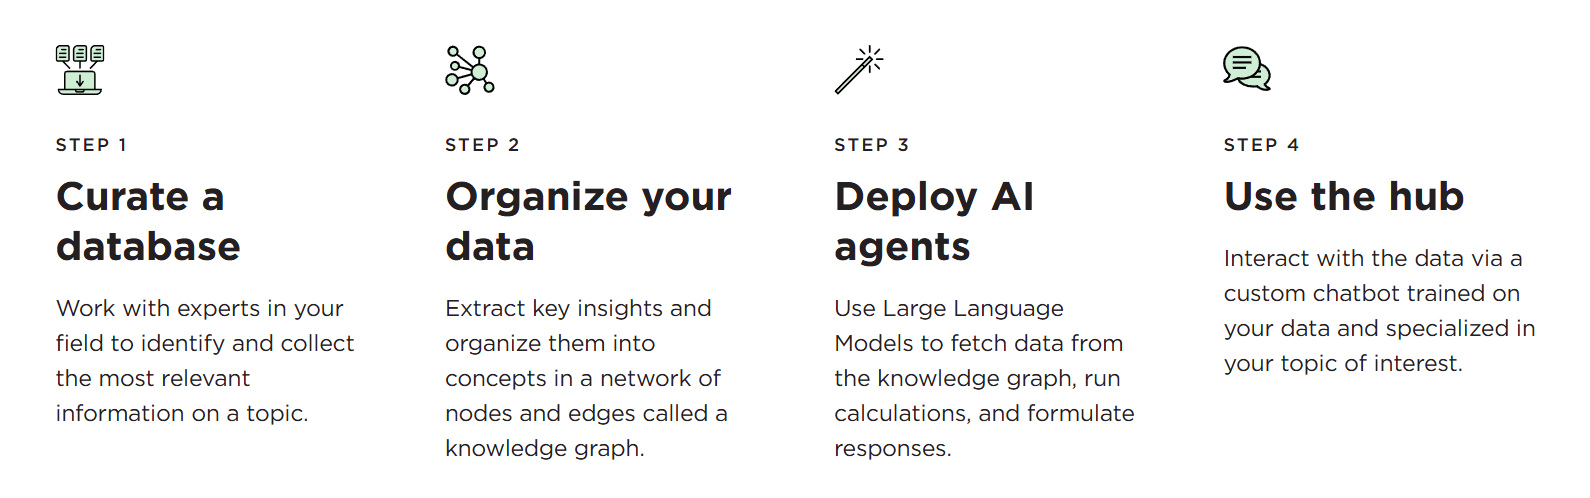
To build a system like this, we follow four steps:
-
Curate a database.
The first step is to curate a database of relevant information. The topic can be narrow or broad, but starting small helps ensure quality. Laterite is building a knowledge graph on gender and nutrition (see above photo), beginning with five final reports in PDF format. Future versions will include datasets, studies from other organizations, geospatial information, or benchmarks for relevant indicators like the Women’s Empowerment in Agriculture Index (WEAI), or Minimum Dietary Diversity for Women (MDD-W). There’s no limit to what you can add – even photos. What matters most is that a subject expert is involved in the curation step, ensuring the data is accurate, relevant and high quality.
-
Organize your data into a knowledge graph.
Next, we use Neo4j to store our knowledge graphs. We ingest curated data in a structured way, extracting insights, tables, graphs, and images using LLMs and optical recognition software like LandingAI or Mistral OCR. LLMs then parse through the insights and index it, generating a text description for all the structured data (e.g., tables, graphs, images) and extracting text directly from documents. LLMs are then further used to structure the text into a knowledge graph – creating a network of nodes and edges representing the original content. Human oversight is important to ensure that: 1) the ingested information is relevant and captured at a high quality; and 2) the structure of the graph is logical for your topic and aligned with how your organization thinks about programs, outcomes, and contexts.
-
Deploy AI to fetch data and form responses.
Agentic AI workflows play a critical role in GraphRAG by: 1) interpreting natural language user prompts; 2) formulating Cypher queries (Neo4j’s query language) and vector queries to fetch relevant data from the graph; 3) writing code for conducting additional analysis or computations with the fetched data; 4) formulating a natural language response to return to the user, including visualizations (e.g., tables, graphs). It’s these LLM agents that enable the user to communicate with the knowledge graph and instruct the system, connecting disparate data points that otherwise would not be able to speak with one another. This is where GraphRAG becomes especially valuable for the social impact sector: researchers, monitoring and evaluation teams, and policymakers can ask complex questions in plain language and receive AI-generated answers grounded in their own data.
-
Build a user interface to interact with the system.
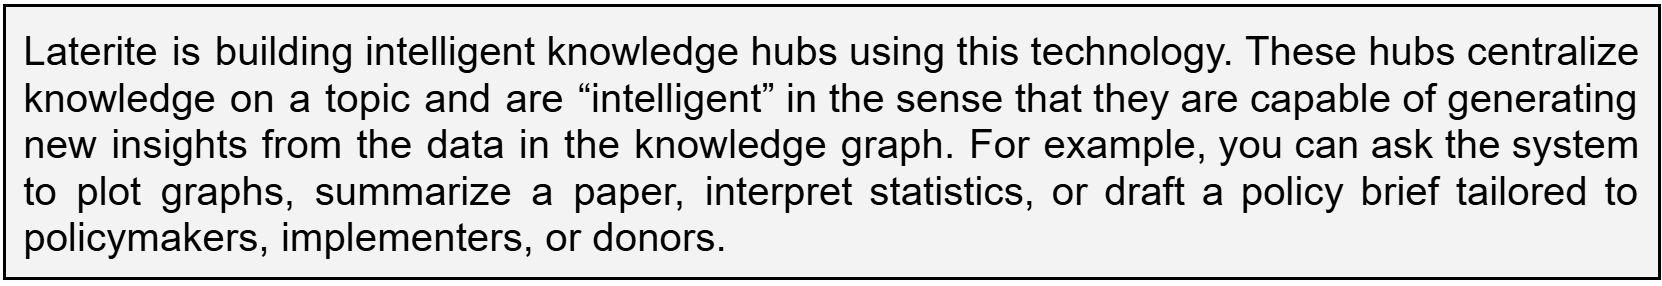
Lastly, we create a user-friendly chat interface where you can communicate with the knowledge graph, and get the insights you’re looking for. The ability to chat with your data in natural language is another incredible advantage with this approach to knowledge management. It’s like speaking to a subject-matter expert with encyclopedic knowledge on your topic – always available, and always up to date with your latest evidence.
Opportunities and reflections
We’re only scratching the surface. At Laterite, GraphRAG is already transforming how our teams work internally, and we’re convinced it can do the same for policymakers, donors, implementers, and researchers across the sector who are struggling to make sense of growing volumes of data and evidence.
It’s time to start connecting the dots (nodes). By combining existing data in this way we can give it a second life. Whether you’re working on a small and narrow topic, or a broad and complex one, a GraphRAG approach to knowledge management could help generate entirely new insights from the data you already have. It could mean the difference between spending tens of thousands of dollars on a new study, or realizing that you actually have the data you need to answer that research question. Furthermore, an intelligent knowledge hub might allow you to target any new research towards evidence gaps, rather than duplicating efforts. If we use our limited resources wisely we can begin to eliminate the digital graveyard once and for all.