Sound research requires sound data. There is much hype about how Big Data can lead to unprecedented innovation, but there is far less talk about data quality. Particularly in low-income contexts, data quality can be a significant roadblock. Many agricultural interventions aim to improve smallholder farm yields through, for example, the adoption of good agricultural practices, or procurement of improved inputs (seeds, tools, etc.). However, on-farm yields are infamously difficult to measure and researchers often rely on farmer recall, which has known shortcomings. It’s important to explore alternative methods to estimate coffee yield, so program implementers and policy-makers can make decisions based on quality data.
In this blog, I explore the drawbacks and benefits of using farmer recall data to measure coffee crop yields in the Kenyan context, by comparing it to a model using image recognition technology.
What is farmer recall data and why does it have a reputation for being inaccurate?
Many surveys ask farmers to recall from memory their crop yields and incomes from the previous harvest season. This data is notoriously inaccurate for various reasons. For example, in Central Kenya, farmers often make many deliveries of coffee throughout the harvest season. There are also two harvest seasons, making it difficult for farmers to remember the exact amounts yielded in previous months or seasons. Issues with recall data are well known across many contexts, and are not limited to the area of agriculture. After all, remembering things is difficult!
Could farm data-driven approaches to model crop yields be a good alternative?
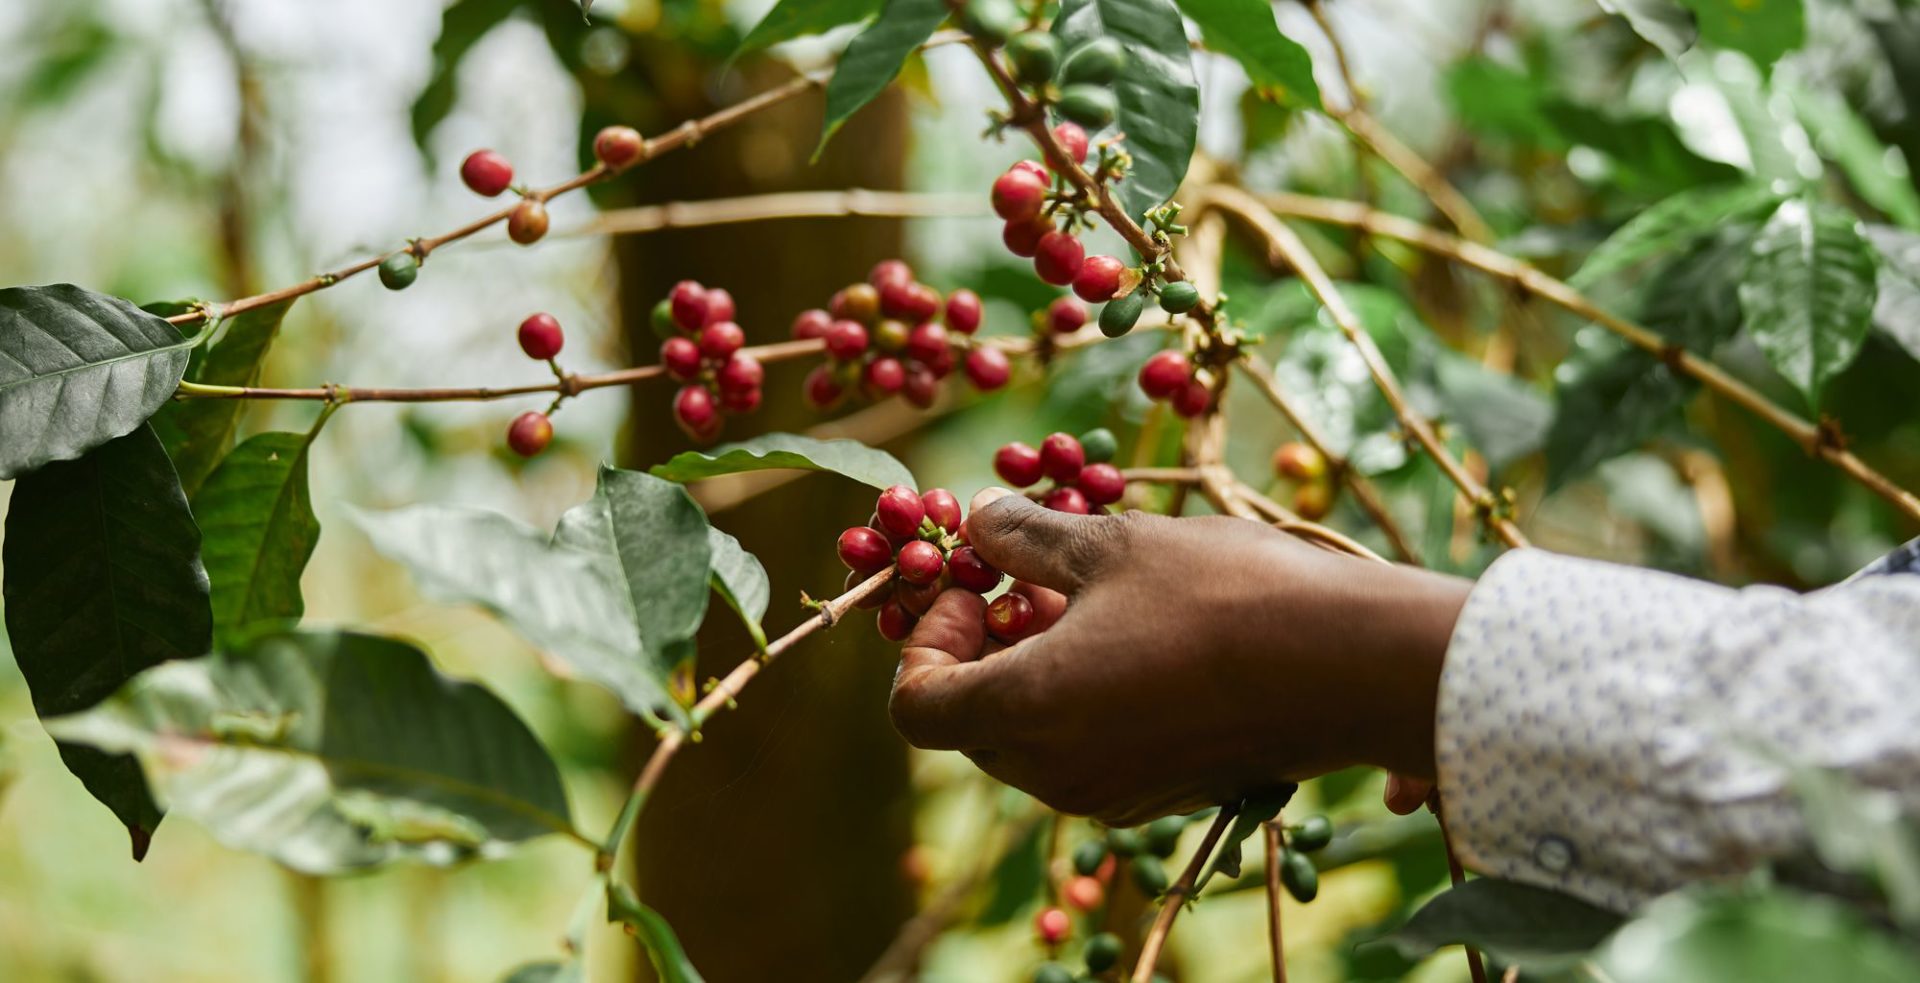
In our work with TechnoServe in Kenya, we built a model that uses machine learning to count ripe coffee cherries based on photographs of branches of coffee trees. The model is based on the idea that yield is a function of the number of trees on a farm, the number of branches on each tree, and the number of cherries on each branch. If we can sample trees and branches from farms and use an algorithm to count cherries, then we may be able to reasonably estimate coffee yield.
To create the model, we first created a dataset of images of coffee branches and tagged the images to train the detection algorithm to identify coffee cherries. We then tested the algorithm by sending enumerator teams to farms to count cherries as well as taking photos of coffee tree branches. We applied the algorithm to the enumerator images and used an error correction algorithm to adjust and compare computer predictions to human predictions.
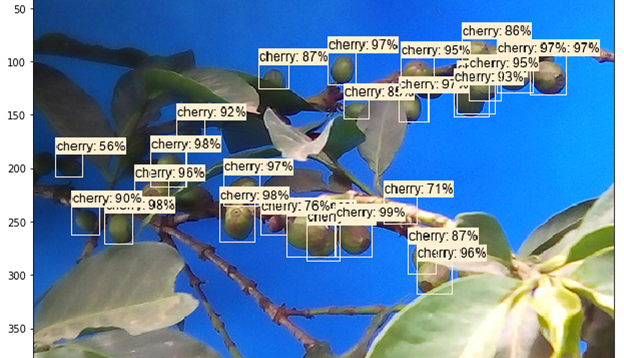
At first, accuracy was low. The algorithm overestimated the number of cherries on branches with few cherries, and underestimated the number of cherries on branches with many cherries. However, after applying the error correction algorithm, we were able to significantly improve the predictions. In the end, the object detection algorithm’s cherry counts are nearly identical to those of humans.
An image of the refined object detection algorithm at work:
How does recall data compare to the data-driven model to estimate coffee yield in Kenya?
While the object detection algorithm can count cherries almost perfectly, it doesn’t improve on farmer recall. Understanding why can give us key insights for future research.
In Central Kenya, all coffee farmers with small plots (less than five acres) are required to be part of cooperatives. They are not allowed to sell outside the cooperatives, which facilitate farmer payments once per year, keep digital records, and provide farmers with receipts at time of payment. We used the cooperative records to establish the ‘true’ measure of yield, since on paper, all of coffee farmers’ yields should be sold to the cooperative (an assumption we verified with survey data). This measure was used to train our models to estimate true yield.
We tried using machine-learning techniques to estimate yields based on cherry, branch and tree counts. We also included satellite data, farm characteristics, and socio-economic characteristics as additional predictor variables. However, we were ultimately unable to improve on farmer recall due to the uniqueness of the Kenyan cooperative structure.
We found that farmer recall is very accurate among smallholder coffee farmers in Central Kenya — if farmers are asked at the right time of year. Timing is critical here: it was important to ask farmers to estimate their yields after they had received payments from the cooperative, rather than directly after harvest season, as there is often a lag. Once farmers had received their receipts from the cooperatives, they were able to provide very accurate yield estimates.
So what have we learned?
Simple, low-tech solutions sometimes can be more powerful than state of the art high-tech solutions. In addition, understanding local market structures is key for data quality. And giving surveys at the right time can improve recall data.
We also found that improving farmer recall in farm size variables is just a matter of understanding what farmers are most comfortable with. While farmers overestimated their farm areas (in acres) by 3 times on average, they estimated the number of coffee trees on their farms with almost no error.
This is not to say high-tech solutions cannot work. It’s worth continuing to explore ways to improve the data-driven model in other contexts, for example, for different crops or to measure changes in urban environments. High-tech methods may certainly complement survey methods in the future to improve data quality, but sometimes the simplest solutions are best.
Michael Keenan is a PhD candidate at Wageningen University and Research, based in Nairobi, Kenya. He has collaborated regularly with Laterite since his tenure as a Summer Associate at Laterite’s Rwanda office in 2017.