“How many coffee trees do you have?” seems like a simple question. In the context of answering a survey, this is surprisingly hard for many smallholder farmers to answer accurately. Farmers who’ve never bought, planted or counted their trees are likely to give inaccurate or biased responses. There’s also some evidence saying farmers may provide intentionally inaccurate information due to mistrust of how the data will be used.
Still, knowing the correct coffee tree count is crucial for researchers interested in yield and productivity.
Earlier this year, we surveyed 810 coffee farmers in Western Uganda as part of a baseline evaluation for a One Acre Fund project with HereWeGrow. We wanted to know to what extent coffee farmers could estimate their number of coffee trees, and whether they tended to under- or overestimate.
We selected a subset of 48 farmers and manually counted their trees, comparing our results to estimates they provided during an earlier survey. This gave us insights into estimation errors—whether they were random or biased—and what factors influenced accuracy.
How we measured coffee tree count
Preparation
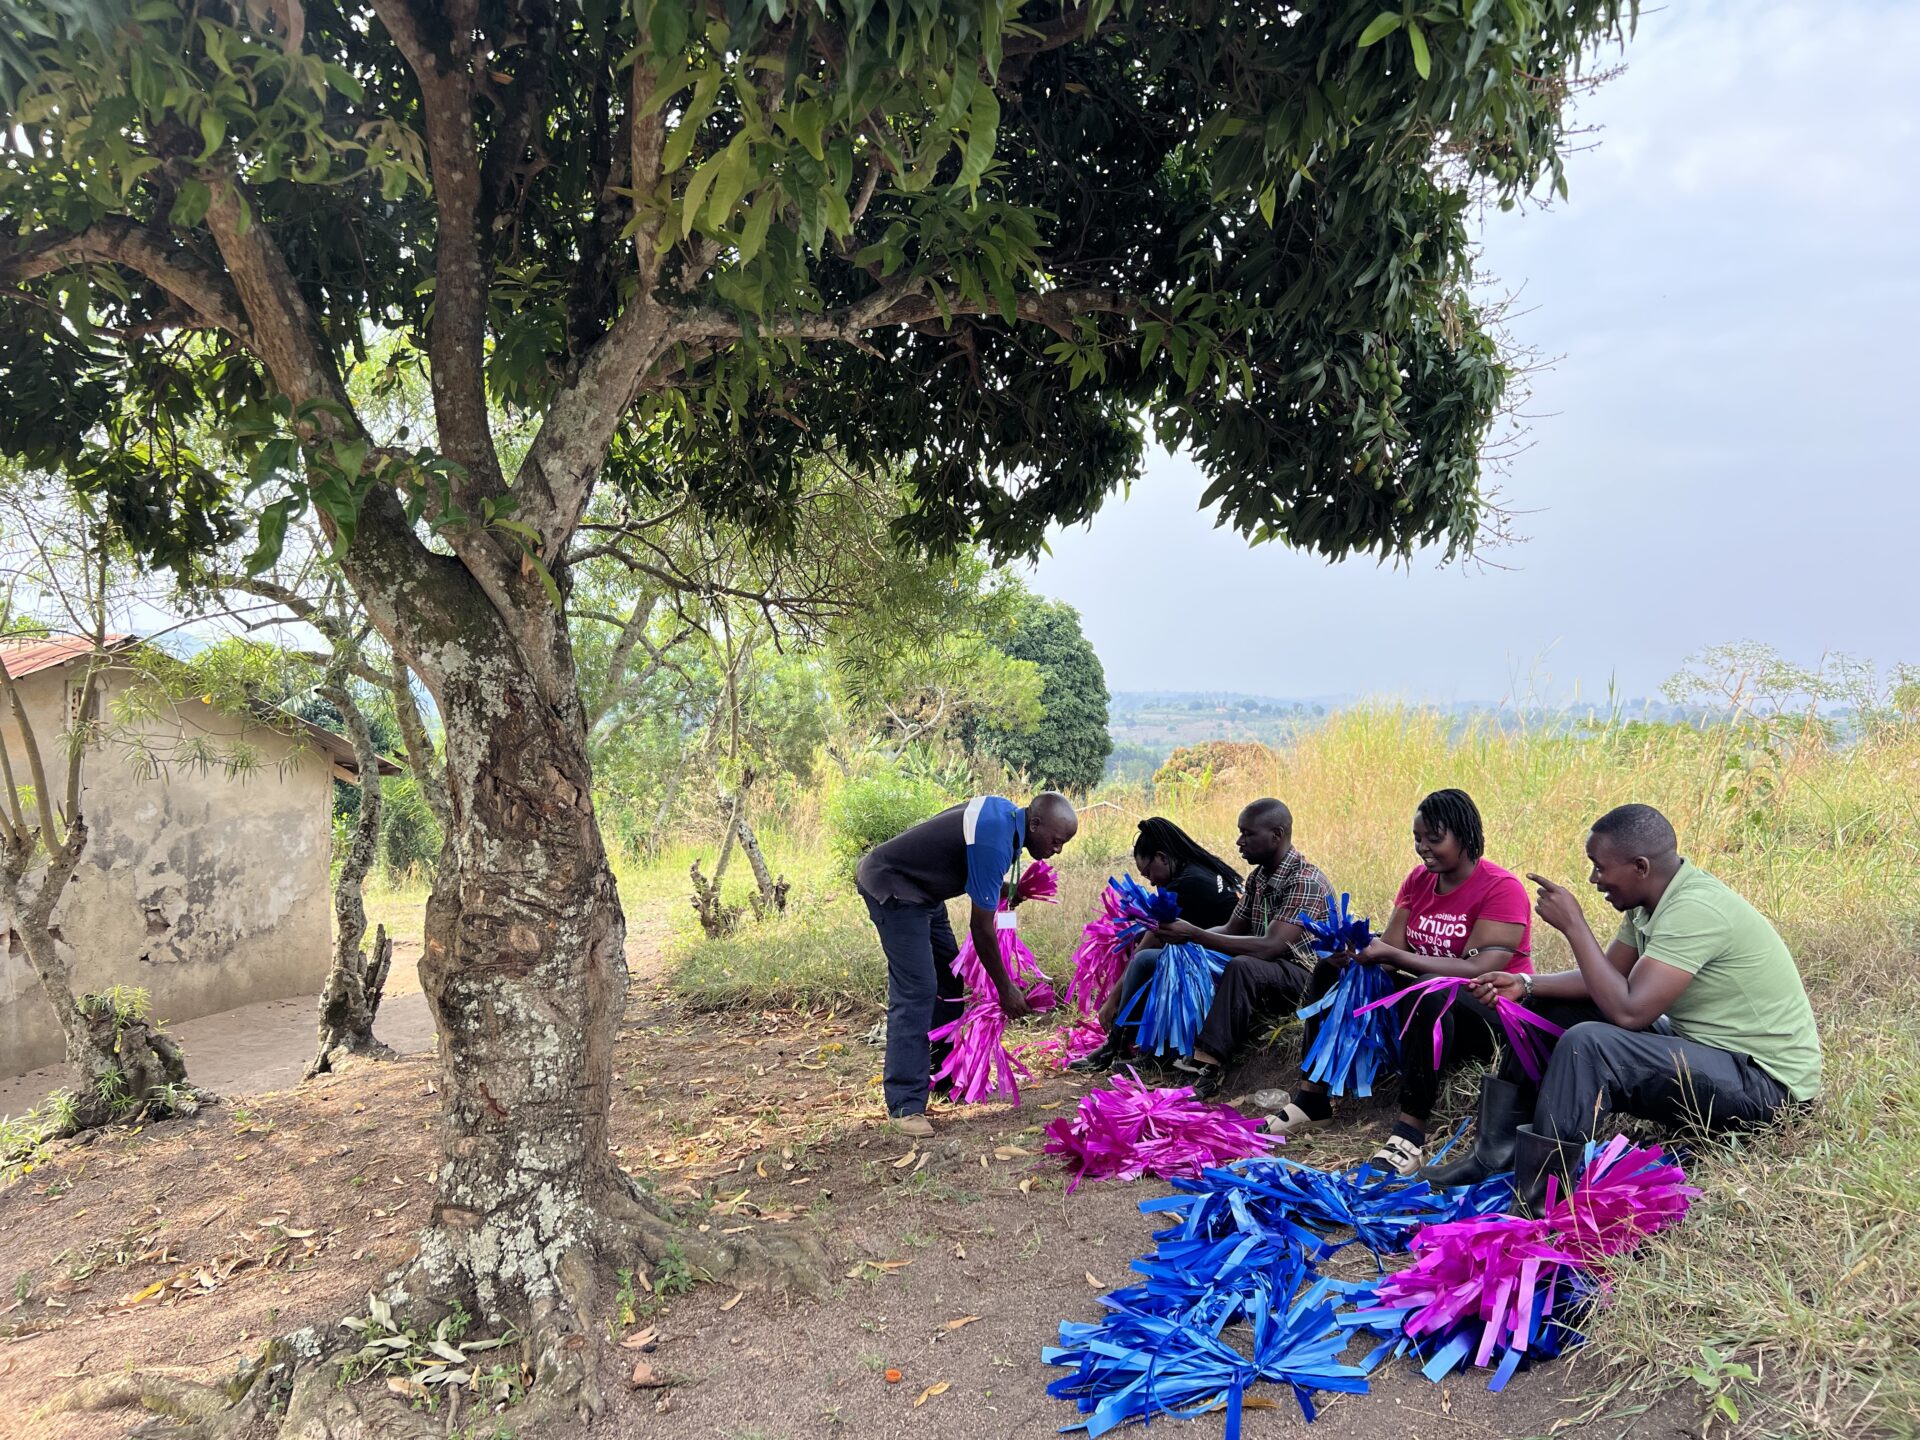
We used ribbons to count trees, organized in three distinct colors and bundled in fixed numbers. This allowed us to easily track the total number of ribbons before starting the tying process. We could estimate how many we had tied by simply counting the leftover ribbons. Each team carried ribbons based on the farmer’s estimate, creating a bridge between perceived and actual numbers.

Team deployment
Teams were deployed based on the size of the farm and the number of trees reported by the farmer. Four teams per district worked to conduct two sessions daily. In the morning, they tied ribbons to trees; in the afternoon, they swapped farms to remove the ribbons as part of the verification process.
Farm selection
The farms were randomly selected, but mirrored the larger sample size’s distribution. We used a two-stage clustered sampling technique based on geography*. Four farms within the same village were selected to facilitate easy swapping between teams. This arrangement minimized the time required for teams to travel between farms, enhancing efficiency. Farms were selected to represent a mix of larger farms (with approximately over 600 trees) and smaller farms (with fewer than 500 trees).
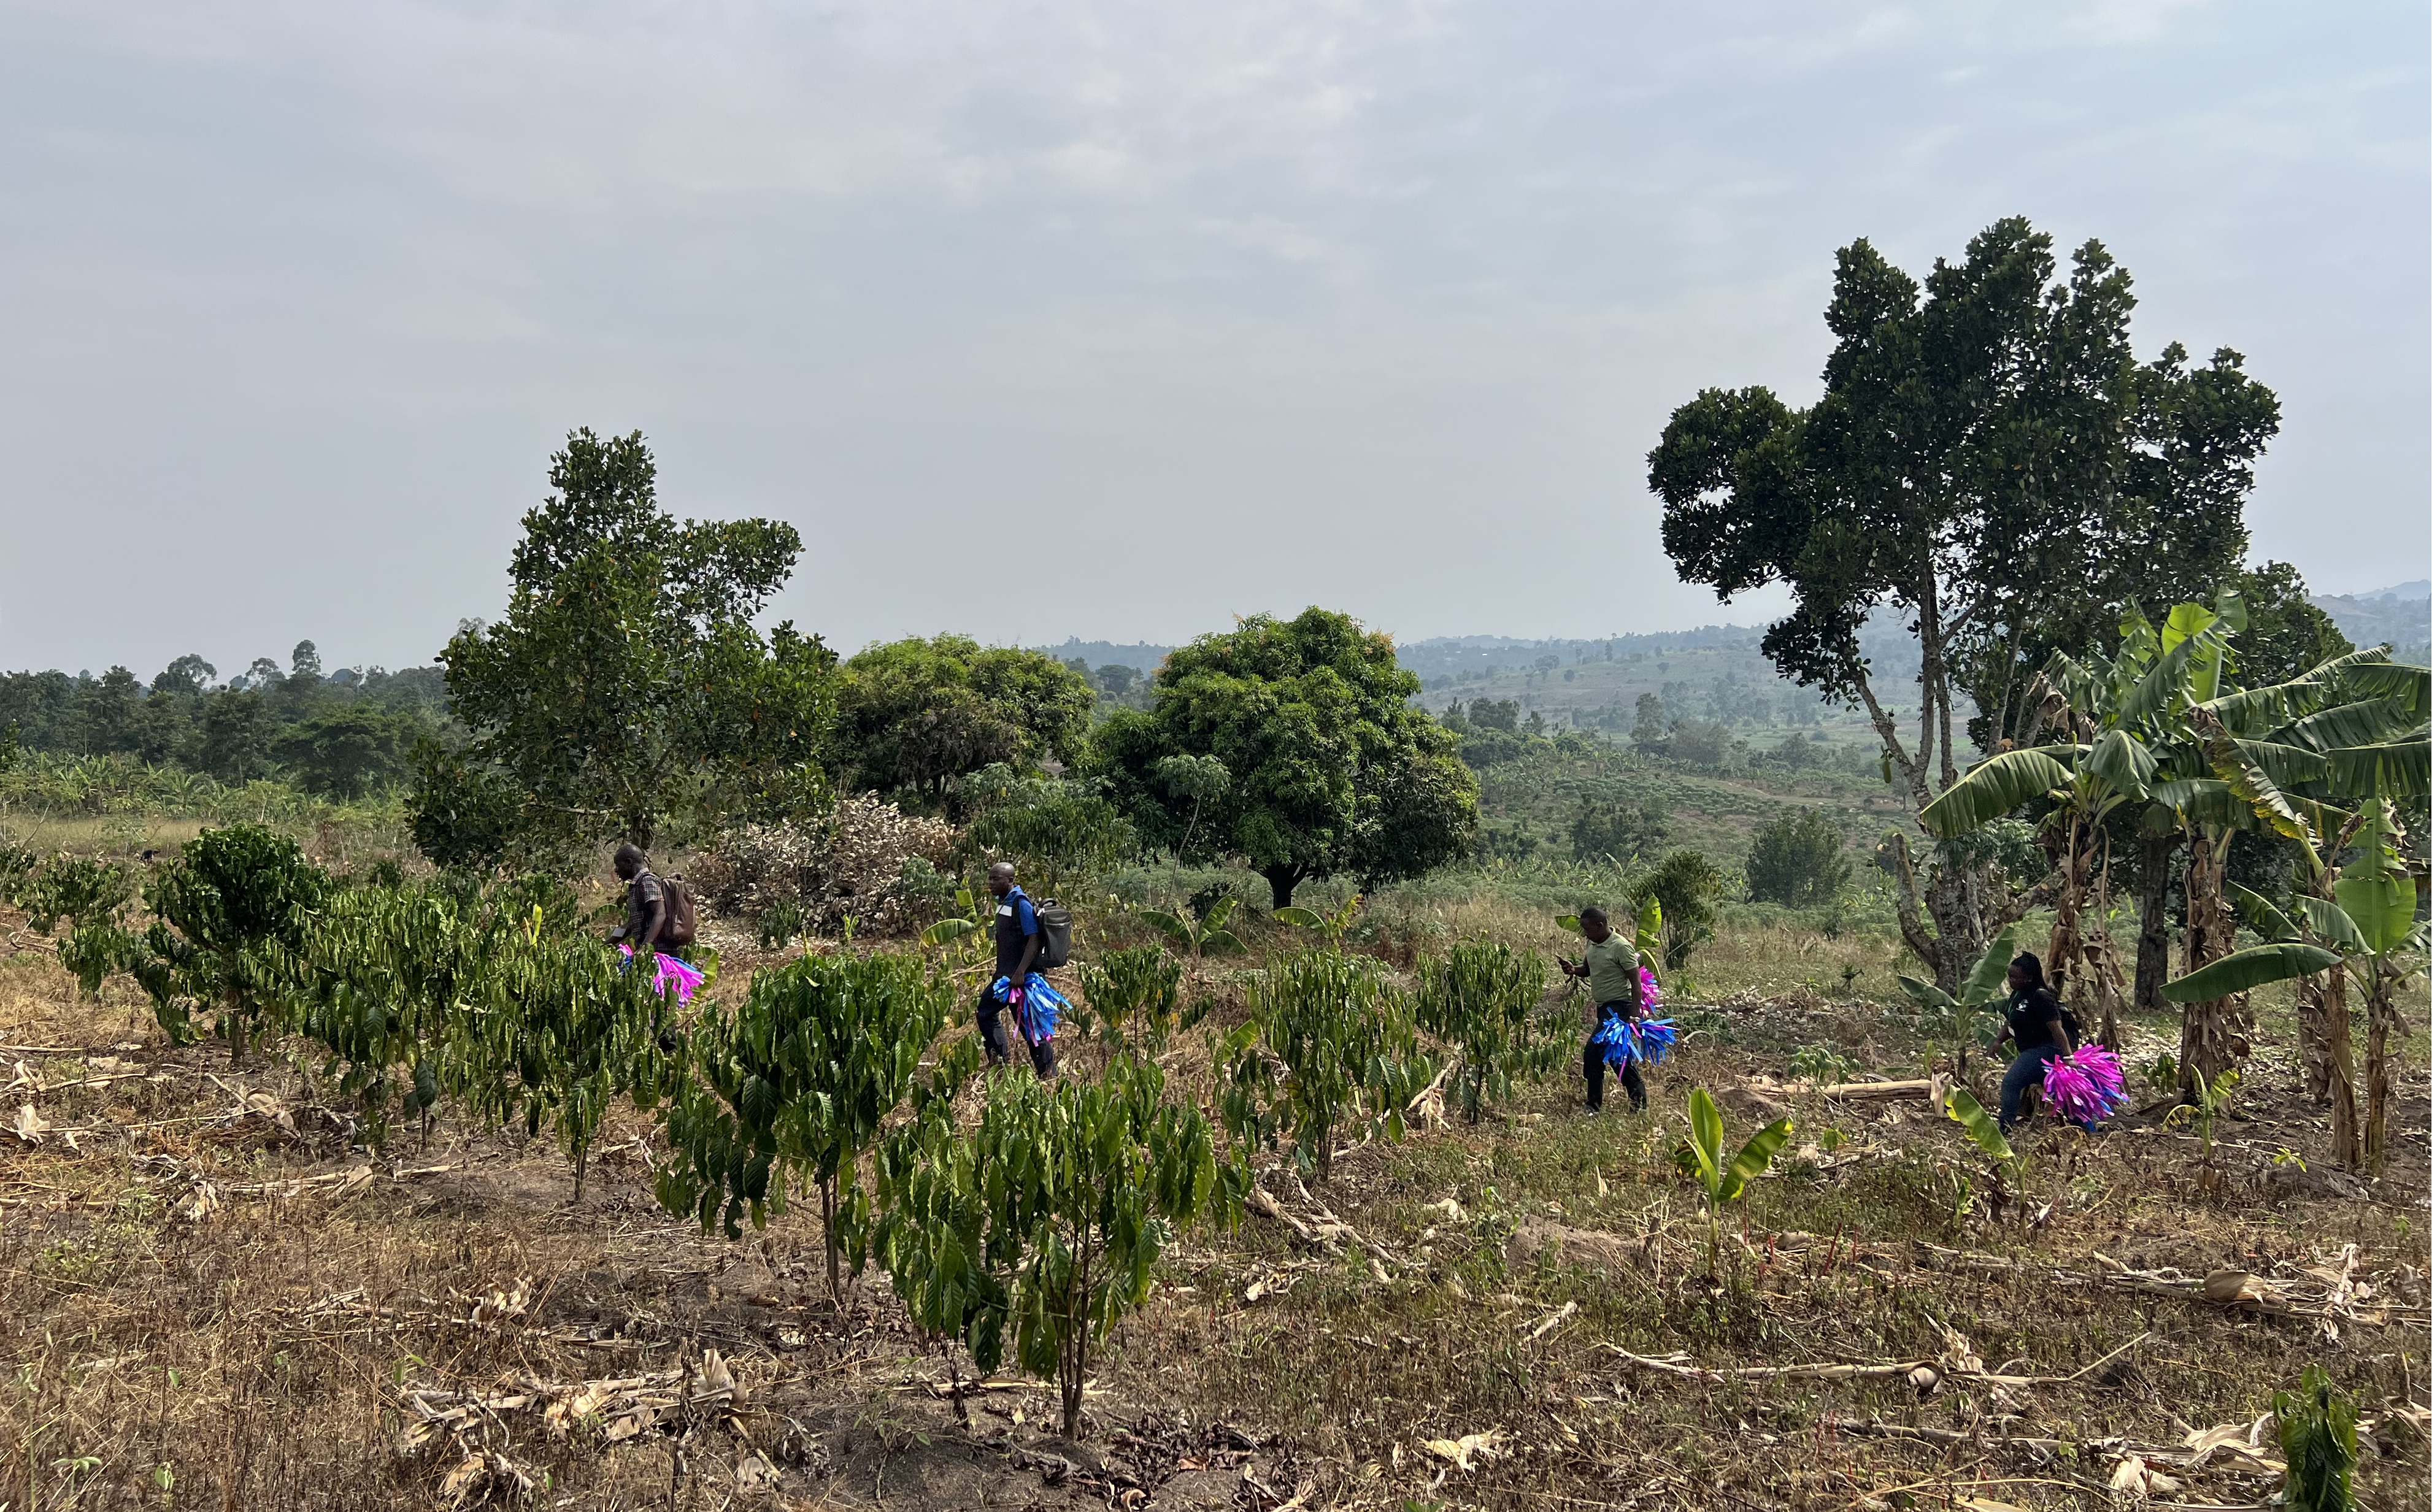
Ribbon tying
Before starting, teams checked the ribbon count. The number of ribbons brought in was based on the farmer’s own coffee tree count estimate. Each tree was tagged using one of three ribbon colors; representing productive, non-productive (young, old, sick), or stumped trees**. After tying, the teams recounted leftover ribbons to provide an estimated count disaggregated by tree status. These results were documented, and a short survey was conducted with the farmer. To document the quality of tree stumping, we also asked farmers to take pictures of some stumped trees.
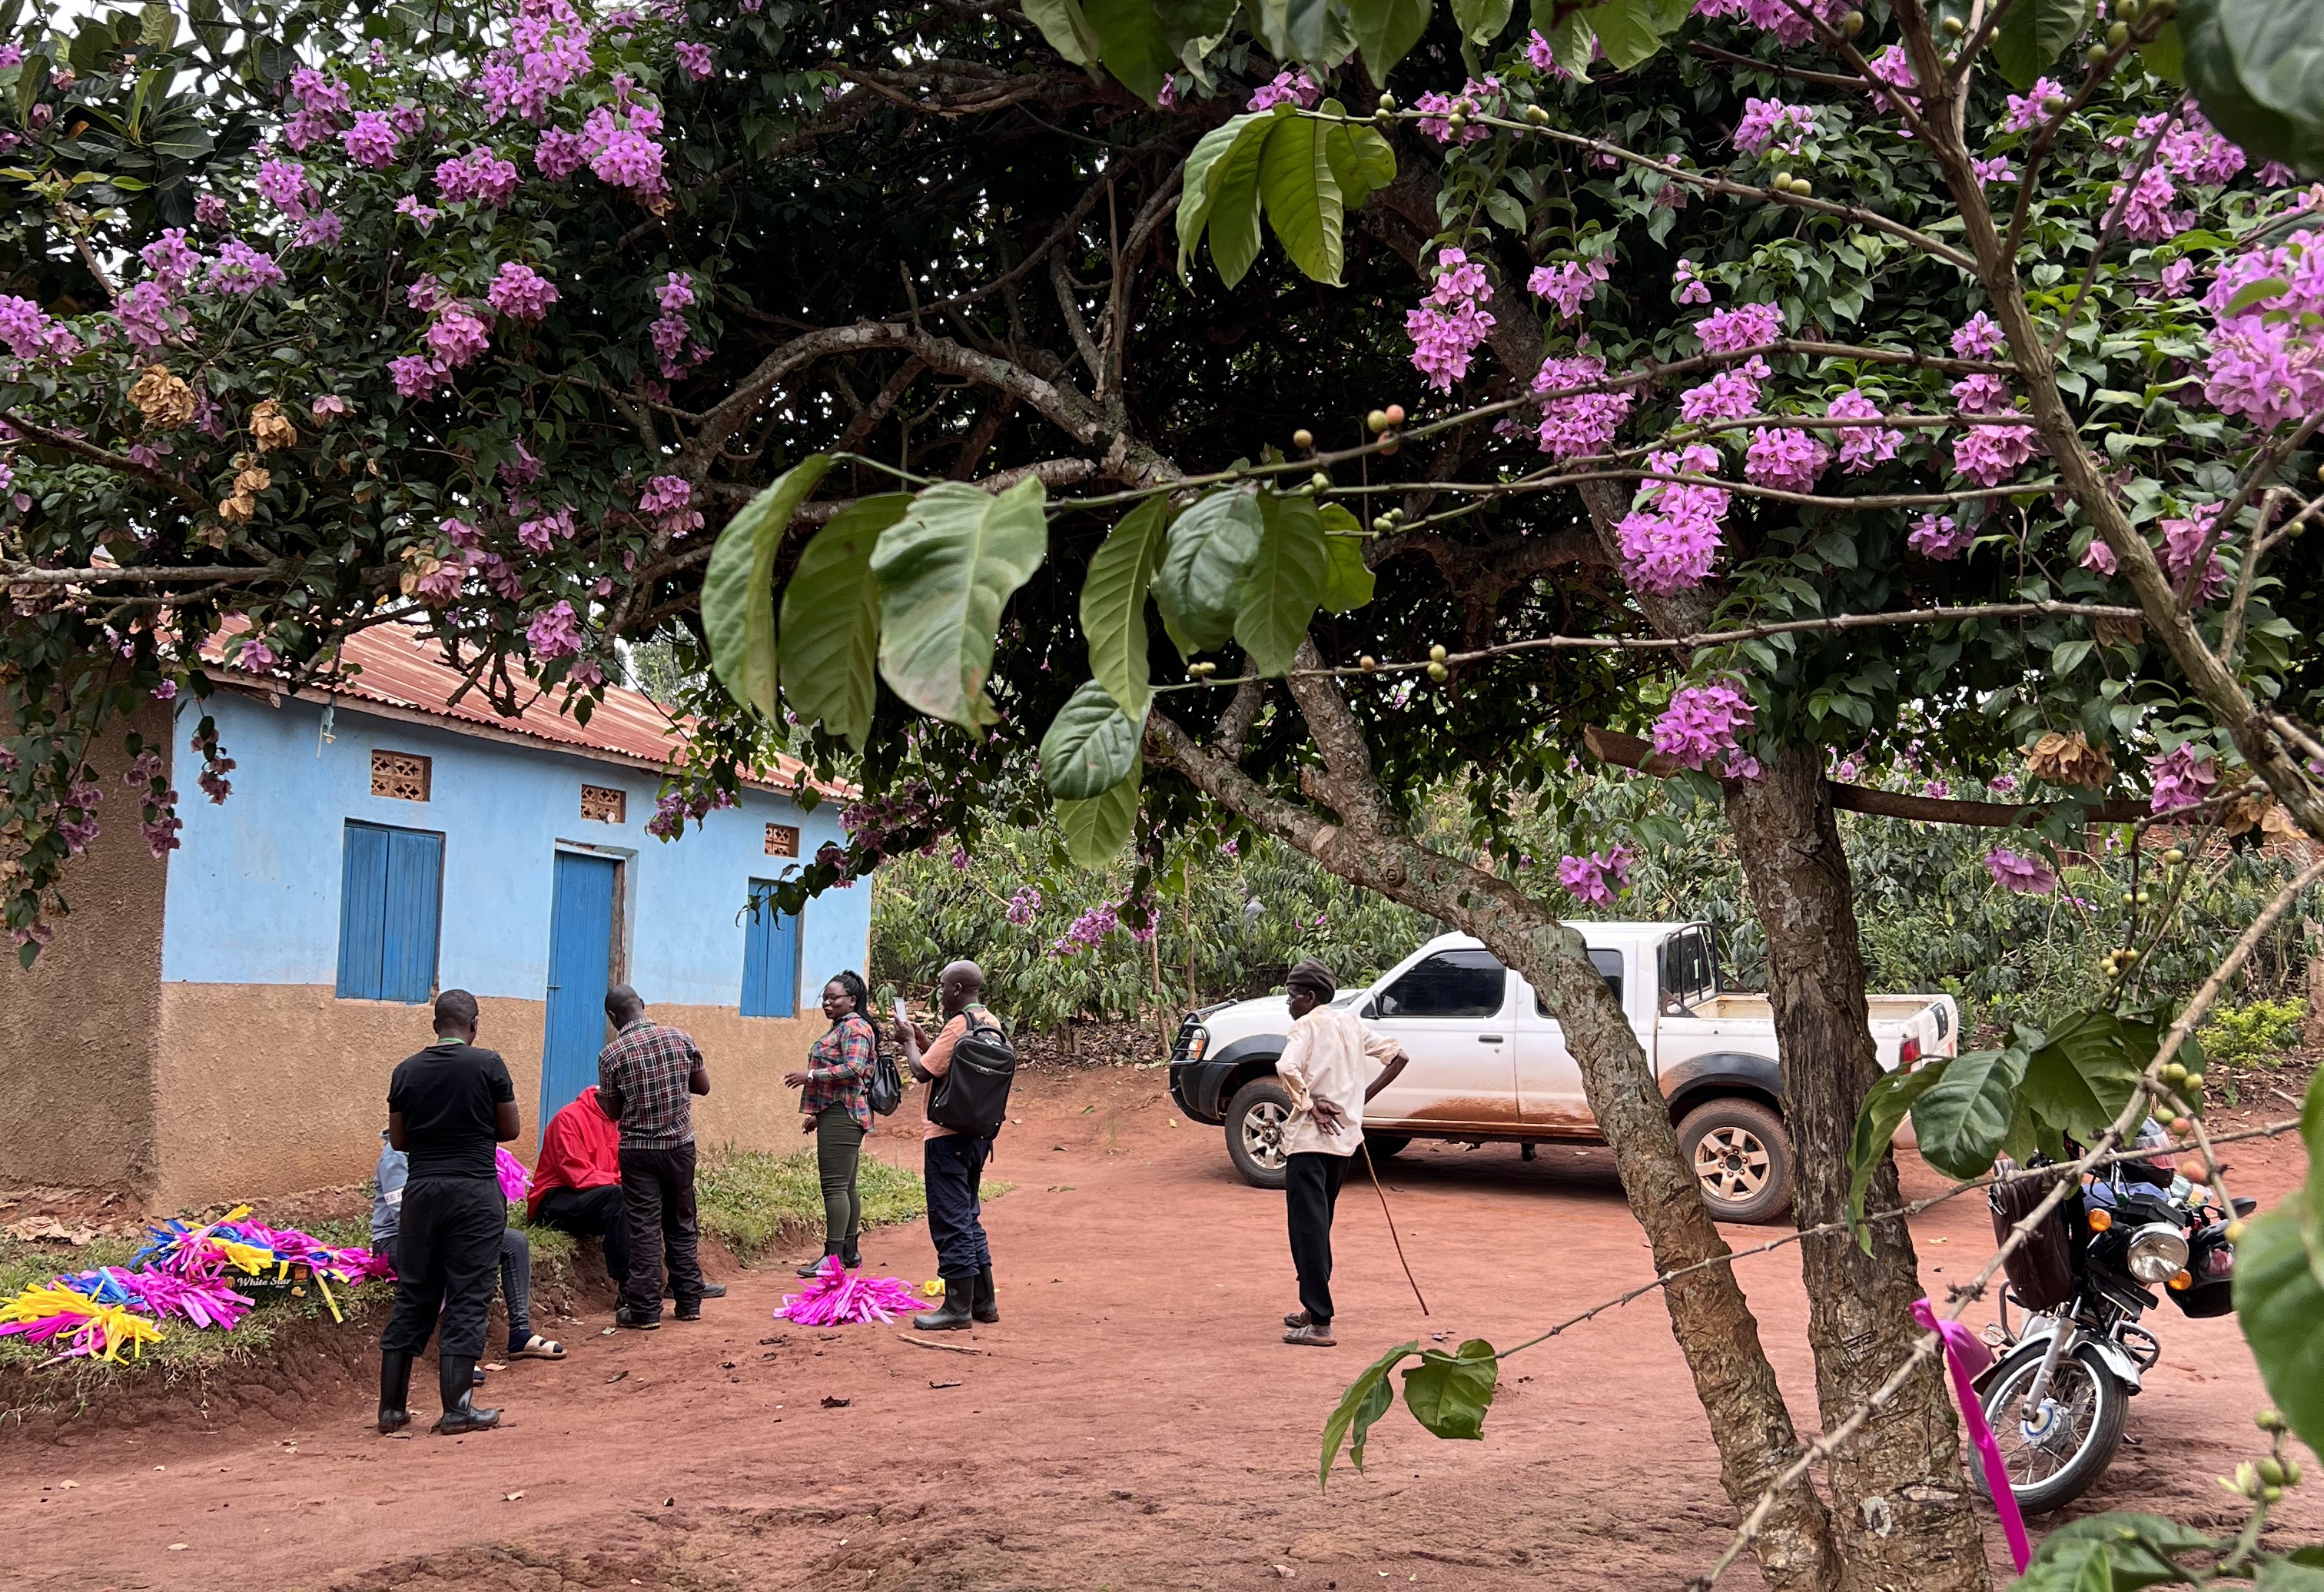
Ribbon removal and verification
During the second session, teams switched farms and removed ribbons. This step served as a quality check to minimize human error. Depending on the farm’s size, local residents were sometimes recruited to help. After removal, the ribbons in each color were counted again and unmarked trees were noted. The results of the verification were also entered in a short survey and compared with the first counting process.
What we learned
Our analysis focused on three aspects: whether farmers tended to under- or overestimate their number of coffee trees, the difference between the average overestimation bias and underestimation bias, and the overall size of their estimation errors.
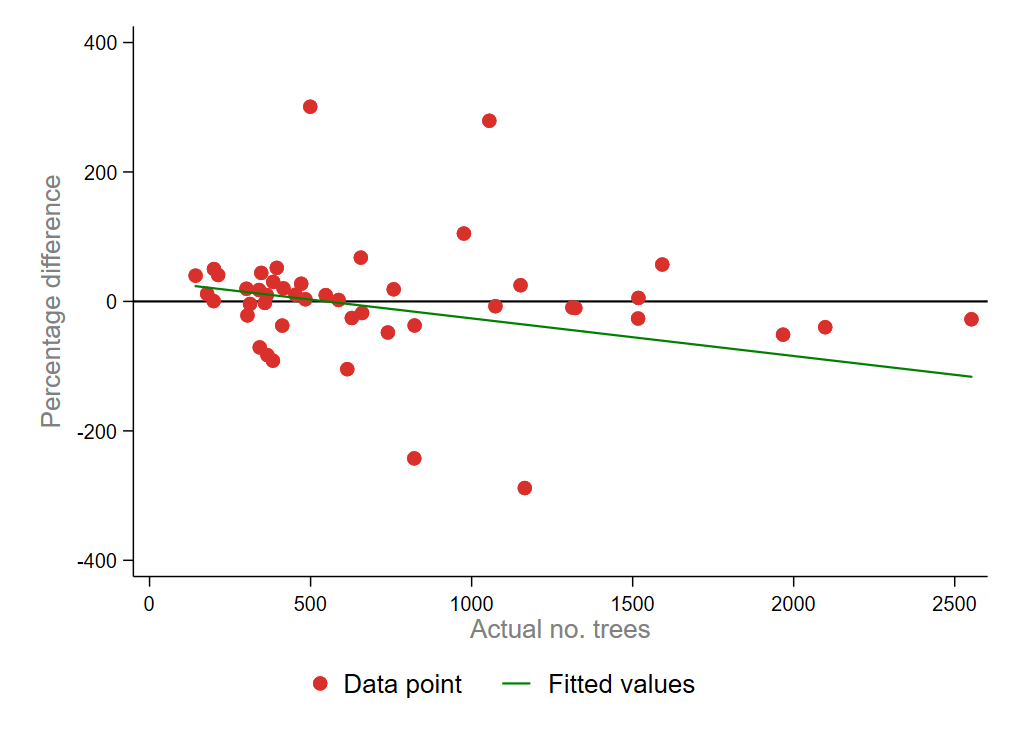
Interestingly, the results showed no strong tendency in one direction. Farmers were almost evenly split between underestimating and overestimating their tree counts. This pattern remained consistent even if we broke the data down by gender, education level and farming experience. In other words, these demographics didn’t influence whether a farmer tended to misjudge above or below the real count.
However, a clear pattern emerged among farmers with larger coffee farms. We found that these farmers had difficulties estimating tree count. Their estimation error was significantly larger than other respondents. This makes sense: recalling numbers below 400 is easier than something closer to 1,500. Non-household heads may also be less involved in daily farm operations and less familiar with details such as numbers of trees.
Conclusion
Although the sample size of farms we manually counted was small, the insights are still useful. We’ve learned that errors might be random, which could be cancelled out with larger samples. But errors could increase when the farm size increases. This calls for more caution when relying on tree count estimates from farmers managing extensive plots close to 1,000 trees.
The insights of this study help us estimate farmers’ coffee yield—one of the key outcome variables in the main One Acre Fund project. For this project, One Acre Fund collected yield data from eight random trees per household. By extrapolating the yield of those eight trees to the total number of trees on the farm, we’re able to estimate a farm’s total yield. Our findings on overestimation biases and errors across different types of farmers help us to improve this estimation and provide better coffee yield insights.
This blog is written by Research Analyst Jurrian Nannes and Research Operations Supervisor Muhammed Mukasa, both based in Laterite’s Uganda office.
*Specifically, we used a clustered, stratified sampling technique, with village as the first sampling unit, randomly selecting 12 villages (out of 48), and then randomly selecting four farms per village. We stratified the sample by size across the different clusters, to ensure the size distribution matched that of the main sample
** In our tree count exercise, a stumped tree was counted as a ‘clean stumped’, meaning an old coffee tree which had all its stem cleanly chopped off.